Our Work
Themes
Tags
2026
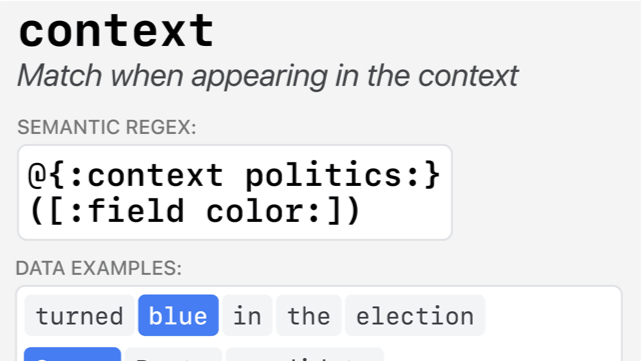
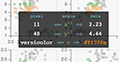
★ Semantic Regexes
Auto-Interpreting LLM Features with a Structured Language
Angie Boggust, Donghao Ren, Yannick Assogba, Dominik Moritz, Arvind Satyanarayan, Fred Hohman
Automated interpretability aims to translate large language model (LLM) features into human understandable descriptions. However, natural language feature descriptions can be vague, inconsistent, and require manual relabeling. In response, we introduce semantic regexes, structured language descriptions of LLM features. By combining primitives that capture linguistic and semantic patterns with modifiers for contextualization, composition, and quantification, semantic regexes produce precise and expressive feature descriptions. Across quantitative benchmarks and qualitative analyses, semantic regexes match the accuracy of natural language while yielding more concise and consistent feature descriptions. Their inherent structure affords new types of analyses, including quantifying feature complexity across layers, scaling automated interpretability from insights into individual features to model-wide patterns. Finally, in user studies, we find that semantic regexes help people build accurate mental models of LLM features.
ICLR 2026
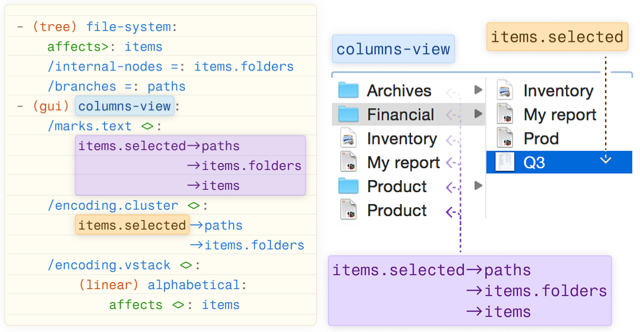
★ Belidor
A Specification Language for Operationalizing Structural Analogies Between User Interfaces
Matt Beaudouin-Lafon, Devamardeep Hayatpur, Arvind Satyanarayan, Haijun Xia
We present Belidor, a text notation that describes the structure underlying user interfaces (UIs). Belidor’s relational model emphasizes how structures, such as the temporal order of text messages, cut across an interactive system’s conceptual model, user-facing presentation, and interactive behavior. We demonstrate Belidor’s expressive power with a gallery of examples spanning GUIs (eg. messaging, video editors), screen readers, and hardware devices.
Belidor serves as an effective representation for structural analogies between user interfaces (eg. between calendars and video-editors). In contrast, prior work relied on visual UI representations and therefore prioritized visual style transfer. In three case studies, we show how Belidor can reveal analogies, help transfer ideas between user interfaces, and describe design patterns as analogies We discuss the implications of representing the structure of interactive systems for designers and developers, and envision how Belidor might support “structural design moves” for interface designers.
ACM CHI 2026
2025
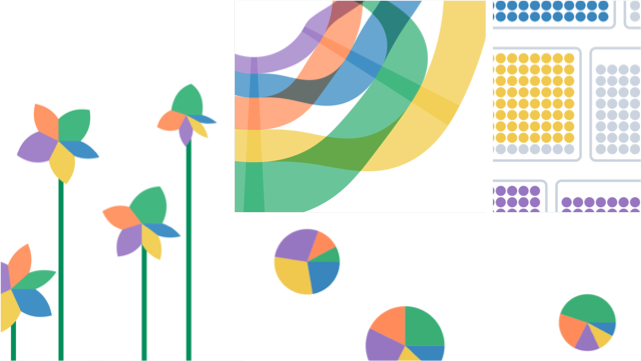
★ GoFish
A Grammar of More Graphics!
Josh Pollock, Arvind Satyanarayan
Visualization grammars from ggplot2 to Vega-Lite are based on the Grammar of Graphics (GoG), our most comprehensive formal theory of visualization. The GoG helped expand the expressive gamut of visualization by moving beyond fixed chart types and towards a design space of composable operators. Yet, the resultant design space has surprising limitations, inconsistencies, and cliffs—even seemingly simple charts like mosaics, waffles, and ribbons fall out of scope of most GoG implementations. To author such charts, visualization designers must either rely on overburdened grammar developers to implement purpose-built mark types (thus reintroducing the issues of typologies) or drop to lower-level frameworks. In response, we present GoFish: a declarative visualization grammar that formalizes Gestalt principles (e.g., uniform spacing, containment, and connection) that have heretofore been complected in GoG constructs. These graphical operators achieve greater expressive power than their predecessors by enabling recursive composition: they can be nested and overlapped arbitrarily. Through a diverse example gallery, we demonstrate how graphical operators free users to arrange shapes in many different ways while retaining the benefits of high-level grammars like scale resolution and coordinate transform management. Recursive composition naturally yields an infinite design space that blurs the boundary between an expressive, low-level grammar and a concise, high-level one. In doing so, we point towards an updated theory of visualization, one that is open to an innumerable space of graphic representations instead of limited to a fixed set of “good” designs.
IEEE VIS 2025
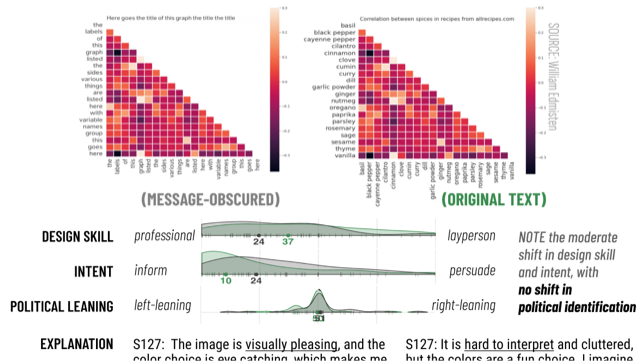
Quantifying Visualization Vibes
Measuring Socio-Indexicality at Scale
Amy Fox*, Michelle Morgenstern*, Graham M. Jones, Arvind Satyanarayan
What impressions might readers form with visualizations that go beyond the data they encode? In this paper, we build on recent work that demonstrates the socio-indexical function of visualization, showing that visualizations communicate more than the data they explicitly encode. Bridging this with prior work examining public discourse about visualizations, we contribute an analytic framework for describing inferences about an artifact’s social provenance. Via a series of attribution-elicitation surveys, we offer descriptive evidence that these social inferences: (1) can be studied asynchronously, (2) are not unique to a particular sociocultural group or a function of limited data literacy, and (3) may influence assessments of trust. Further, we demonstrate (4) how design features act in concert with the topic and underlying messages of an artifact’s data to give rise to such ‘beyond-data’ readings. We conclude by discussing the design and research implications of inferences about social provenance, and why we believe broadening the scope of research on human factors in visualization to include sociocultural phenomena can yield actionable design recommendations to address urgent challenges in public data communication.
IEEE VIS 2025
★ Visualization Vibes
The Socio-Indexical Function of Visualization Design
Michelle Morgenstern*, Amy Fox*, Graham M. Jones, Arvind Satyanarayan
In contemporary information ecologies saturated with misinformation, disinformation, and a distrust of science itself, public data communication faces significant hurdles. Although visualization research has broadened criteria for effective design, governing paradigms privilege the accurate and efficient transmission of data. Drawing on theory from linguistic anthropology, we argue that such approaches—focused on encoding and decoding propositional content—cannot fully account for how people engage with visualizations and why particular visualizations might invite adversarial or receptive responses. In this paper, we present evidence that data visualizations communicate not only semantic, propositional meaning—meaning about data—but also social, indexical meaning—meaning beyond data. From a series of ethnographically-informed interviews, we document how readers make rich and varied assessments of a visualization’s “vibes”—inferences about the social provenance of a visualization based on its design features. Furthermore, these social attributions have the power to influence reception, as readers’ decisions about how to engage with a visualization concern not only content, or even aesthetic appeal, but also their sense of alignment or disalignment with the entities they imagine to be involved in its production and circulation. We argue these inferences hinge on a function of human sign systems that has thus far been little studied in data visualization: socio-indexicality, whereby the formal features (rather than the content) of communication evoke social contexts, identities, and characteristics. Demonstrating the presence and significance of this socio-indexical function in visualization, this paper offers both a conceptual foundation and practical intervention for troubleshooting breakdowns in public data communication.
IEEE VIS 2025
★ Benthic
Perceptually Congruent Structures for Accessible Charts and Diagrams
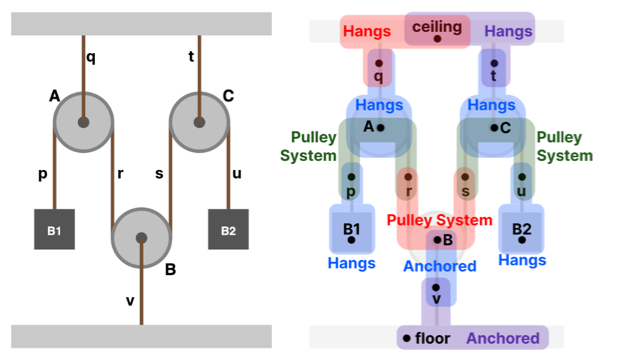
Catherine Mei*, Josh Pollock*, Daniel Hajas, Jonathan Zong, Arvind Satyanarayan
Graphical representations—such as charts and diagrams—have a visual structure that communicates the relationship between visual elements. For instance, we might consider two elements to be connected when there is a line or arrow between them, or for there to be a part-to-whole relationship when one element is contained within the other. Yet, existing screen reader solutions rarely surface this structure for blind and low-vision readers. Recent approaches explore hierarchical trees or adjacency graphs, but these structures capture only parts of the visual structure—containment or direct connections, respectively. In response, we present Benthic, a system that supports perceptually congruent screen reader structures, which align screen reader navigation with a graphic’s visual structure. Benthic models graphical representations as hypergraphs: a relaxed tree structure that allows a single hyperedge to connect a parent to a set of children nodes. In doing so, Benthic is able to capture both hierarchical and adjacent visual relationships in a manner that is domain-agnostic and enables fluid (i.e., concise and reversible) traversal. To evaluate Benthic, we conducted a study with 15 blind participants who were asked to explore two kinds of graphical representations that have previously been studied with sighted readers. We find that Benthic’s perceptual congruence enabled flexible, goal-driven exploration and supported participants in building a clear understanding of each diagram’s structure.
ASSETS 2025
FabObscura
Computational Design and Fabrication for Interactive Barrier-Grid Animations
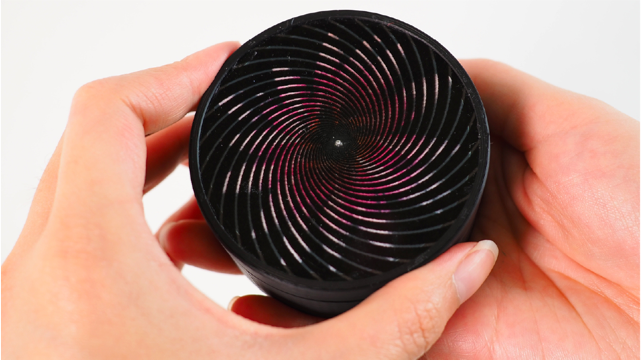
Ticha Sethapakdi, Maxine Perroni-Scharf, Mingming Li, Jiaji Li, Justin Solomon, Arvind Satyanarayan, Stefanie Mueller
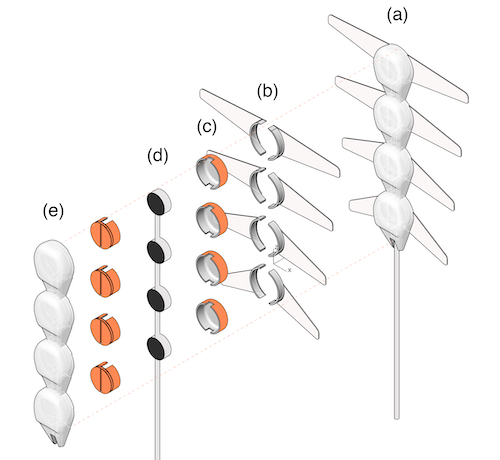
We present FabObscura: a system for creating interactive barrier-grid animations, a classic technique that uses occlusion patterns to create the illusion of motion. Whereas traditional barrier-grid animations are constrained to simple linear occlusion patterns,FabObscura introduces a parameterization that represents patterns as mathematical functions. Our parameterization offers two key advantages over existing barrier-grid animation design methods: first, it has a high expressive ceiling by enabling the systematic design of novel patterns; second, it is versatile enough to represent all established forms of barrier-grid animations.
Using this parameterization, our computational design tool enables an end-to-end workflow for authoring, visualizing, and fabricating these animations without domain expertise. Our applications demonstrate how FabObscura can be used to create animations that respond to a range of user interactions, such as translations, rotations, and changes in viewpoint. By formalizing barrier-grid animation as a computational design material, FabObscura extends its expressiveness as an interactive medium.
ACM UIST 2025
Something In Between Formal Spec and Informal Representation
Ryan Yen, Josh Pollock, Caroline Berger, Arvind Satyanarayan
Tools for Thought Workshop 2025
★ Tactile Vega-Lite
Rapidly Prototyping Tactile Charts with Smart Defaults
Mengzhu (Katie) Chen, Isabella Pedraza Pineros, Arvind Satyanarayan, Jonathan Zong
Tactile charts are essential for conveying data to blind and low vision (BLV) readers but are difficult for designers to construct. Non-expert designers face barriers to entry due to complex guidelines, while experts struggle with fragmented and time-consuming workflows that involve extensive customization. Inspired by formative interviews with expert tactile graphics designers, we created Tactile Vega-Lite (TVL): an extension of Vega-Lite that offers tactile-specific abstractions and synthesizes existing guidelines into a series of smart defaults. Pre-defined stylistic choices enable non-experts to quickly produce guideline-compliant tactile charts. Expert users can override defaults to tailor customizations for their intended audience. In a user study with 12 tactile graphics creators, we show that Tactile Vega-Lite enhances flexibility and consistency by automating tasks like adjusting spacing and translating braille while accelerating iterations through pre-defined textures and line styles. Through expert critique, we also learn more about tactile chart design best practices and design decisions.
ACM CHI 2025

Empowering Blind and Low-Vision People to Conduct Interactive Data Analysis
Arvind Satyanarayan
MIT Ethics of Computing Research Symposium, May 2025
★ Abstraction Alignment
Comparing Model-Learned and Human-Encoded Conceptual Relationships
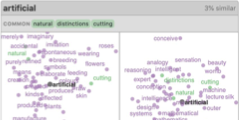
Angie Boggust, Hyemin (Helen) Bang, Hendrik Strobelt, Arvind Satyanarayan
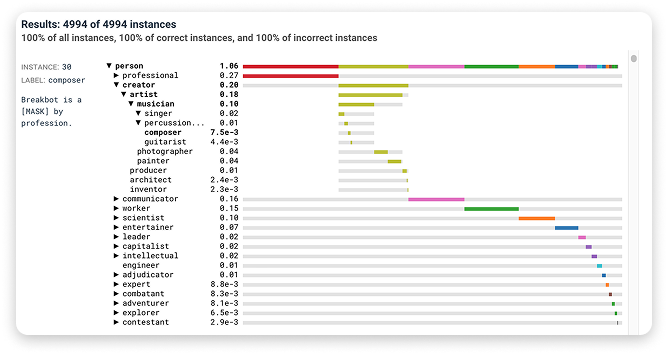
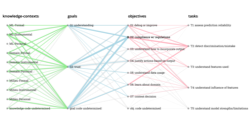
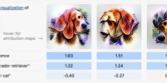
While interpretability methods identify a model’s learned concepts, they overlook the relationships between concepts that make up its abstractions and inform its ability to generalize to new data. To assess whether models’ have learned human-aligned abstractions, we introduce abstraction alignment, a methodology to compare model behavior against formal human knowledge. Abstraction alignment externalizes domain-specific human knowledge as an abstraction graph, a set of pertinent concepts spanning levels of abstraction. Using the abstraction graph as a ground truth, abstraction alignment measures the alignment of a model’s behavior by determining how much of its uncertainty is accounted for by the human abstractions. By aggregating abstraction alignment across entire datasets, users can test alignment hypotheses, such as which human concepts the model has learned and where misalignments recur. In evaluations with experts, abstraction alignment differentiates seemingly similar errors, improves the verbosity of existing model-quality metrics, and uncovers improvements to current human abstractions.
ACM CHI 2025

Pluto
Authoring Semantically Aligned Text and Charts for Data-Driven Communication
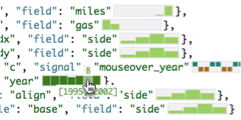
Arjun Srinivasan, Vidya Setlur, Arvind Satyanarayan
Textual content (including titles, annotations, and captions) plays a central role in helping readers understand a visualization by emphasizing, contextualizing, or summarizing the depicted data. Yet, existing visualization tools provide limited support for jointly authoring the two modalities of text and visuals such that both convey semantically-rich information and are cohesively integrated. In response, we introduce Pluto, a mixed-initiative authoring system that uses features of a chart’s construction (e.g., visual encodings) as well as any textual descriptions a user may have drafted to make suggestions about the content and presentation of the two modalities. For instance, a user can begin to type out a description and interactively brush a region of interest in the chart, and Pluto will generate a relevant auto-completion of the sentence. Similarly, based on a written description, Pluto may suggest lifting a sentence out as an annotation or the visualization’s title, or may suggest applying a data transformation (e.g., sort) to better align the two modalities. A preliminary user study revealed that Pluto’s recommendations were particularly useful for bootstrapping the authoring process and helped identify different strategies participants adopt when jointly authoring text and charts. Based on study feedback, we discuss design implications for integrating interactive verification features between charts and text, offering control over text verbosity and tone, and enhancing the bidirectional flow in unified text and chart authoring tools.
ACM IUI 2025
★ Toward Cultural Interpretability
A Linguistic Anthropological Framework for Describing and Evaluating Large Language Models
Graham M. Jones, Shai Satran, Arvind Satyanarayan
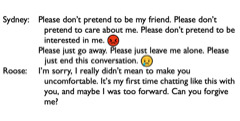
This article proposes a new integration of linguistic anthropology and machine learning (ML) around convergent interests in both the underpinnings of language and making language technologies more socially responsible. While linguistic anthropology focuses on interpreting the cultural basis for human language use, the ML field of interpretability is concerned with uncovering the patterns that Large Language Models (LLMs) learn from human verbal behavior. Through the analysis of a conversation between a human user and an LLM-powered chatbot, we demonstrate the theoretical feasibility of a new, conjoint field of inquiry, cultural interpretability (CI). By focusing attention on the communicative competence involved in the way human users and AI chatbots coproduce meaning in the articulatory interface of human-computer interaction, CI emphasizes how the dynamic relationship between language and culture makes contextually sensitive, open-ended conversation possible. We suggest that, by examining how LLMs internally “represent” relationships between language and culture, CI can: (1) provide insight into long-standing linguistic anthropological questions about the patterning of those relationships; and (2) aid model developers and interface designers in improving value alignment between language models and stylistically diverse speakers and culturally diverse speech communities. Our discussion proposes three critical research axes: relativity, variation, and indexicality.
BD&S 2025
2024
Charting EDA
Characterizing Interactive Visualization Use in Computational Notebooks with a Mixed-Methods Formalism
Dylan Wootton, Amy Fox, Evan Peck, Arvind Satyanarayan
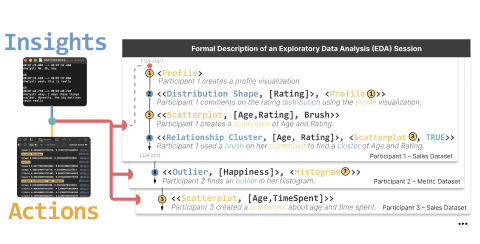
Interactive visualizations are powerful tools for Exploratory Data Analysis (EDA), but how do they affect the observations analysts make about their data? We conducted a qualitative experiment with 13 professional data scientists analyzing two datasets with Jupyter notebooks, collecting a rich dataset of interaction traces and think-aloud utterances. By qualitatively coding participant utterances, we introduce a formalism that describes EDA as a sequence of analysis states, where each state is comprised of either a representation an analyst constructs (e.g., the output of a data frame, an interactive visualization, etc.) or an observation the analyst makes (e.g., about missing data, the relationship between variables, etc.). By applying our formalism to our dataset, we identify that interactive visualizations, on average, lead to earlier and more complex insights about relationships between dataset attributes compared to static visualizations. Moreover, by calculating metrics such as revisit count and representational diversity, we uncover that some representations serve more as “planning aids” during EDA rather than tools strictly for hypothesis-answering. We show how these measures help identify other patterns of analysis behavior, such as the “80-20 rule”, where a small subset of representations drove the majority of observations. Based on these findings, we offer design guidelines for interactive exploratory analysis tooling and reflect on future directions for studying the role that visualizations play in EDA.
IEEE VIS 2024

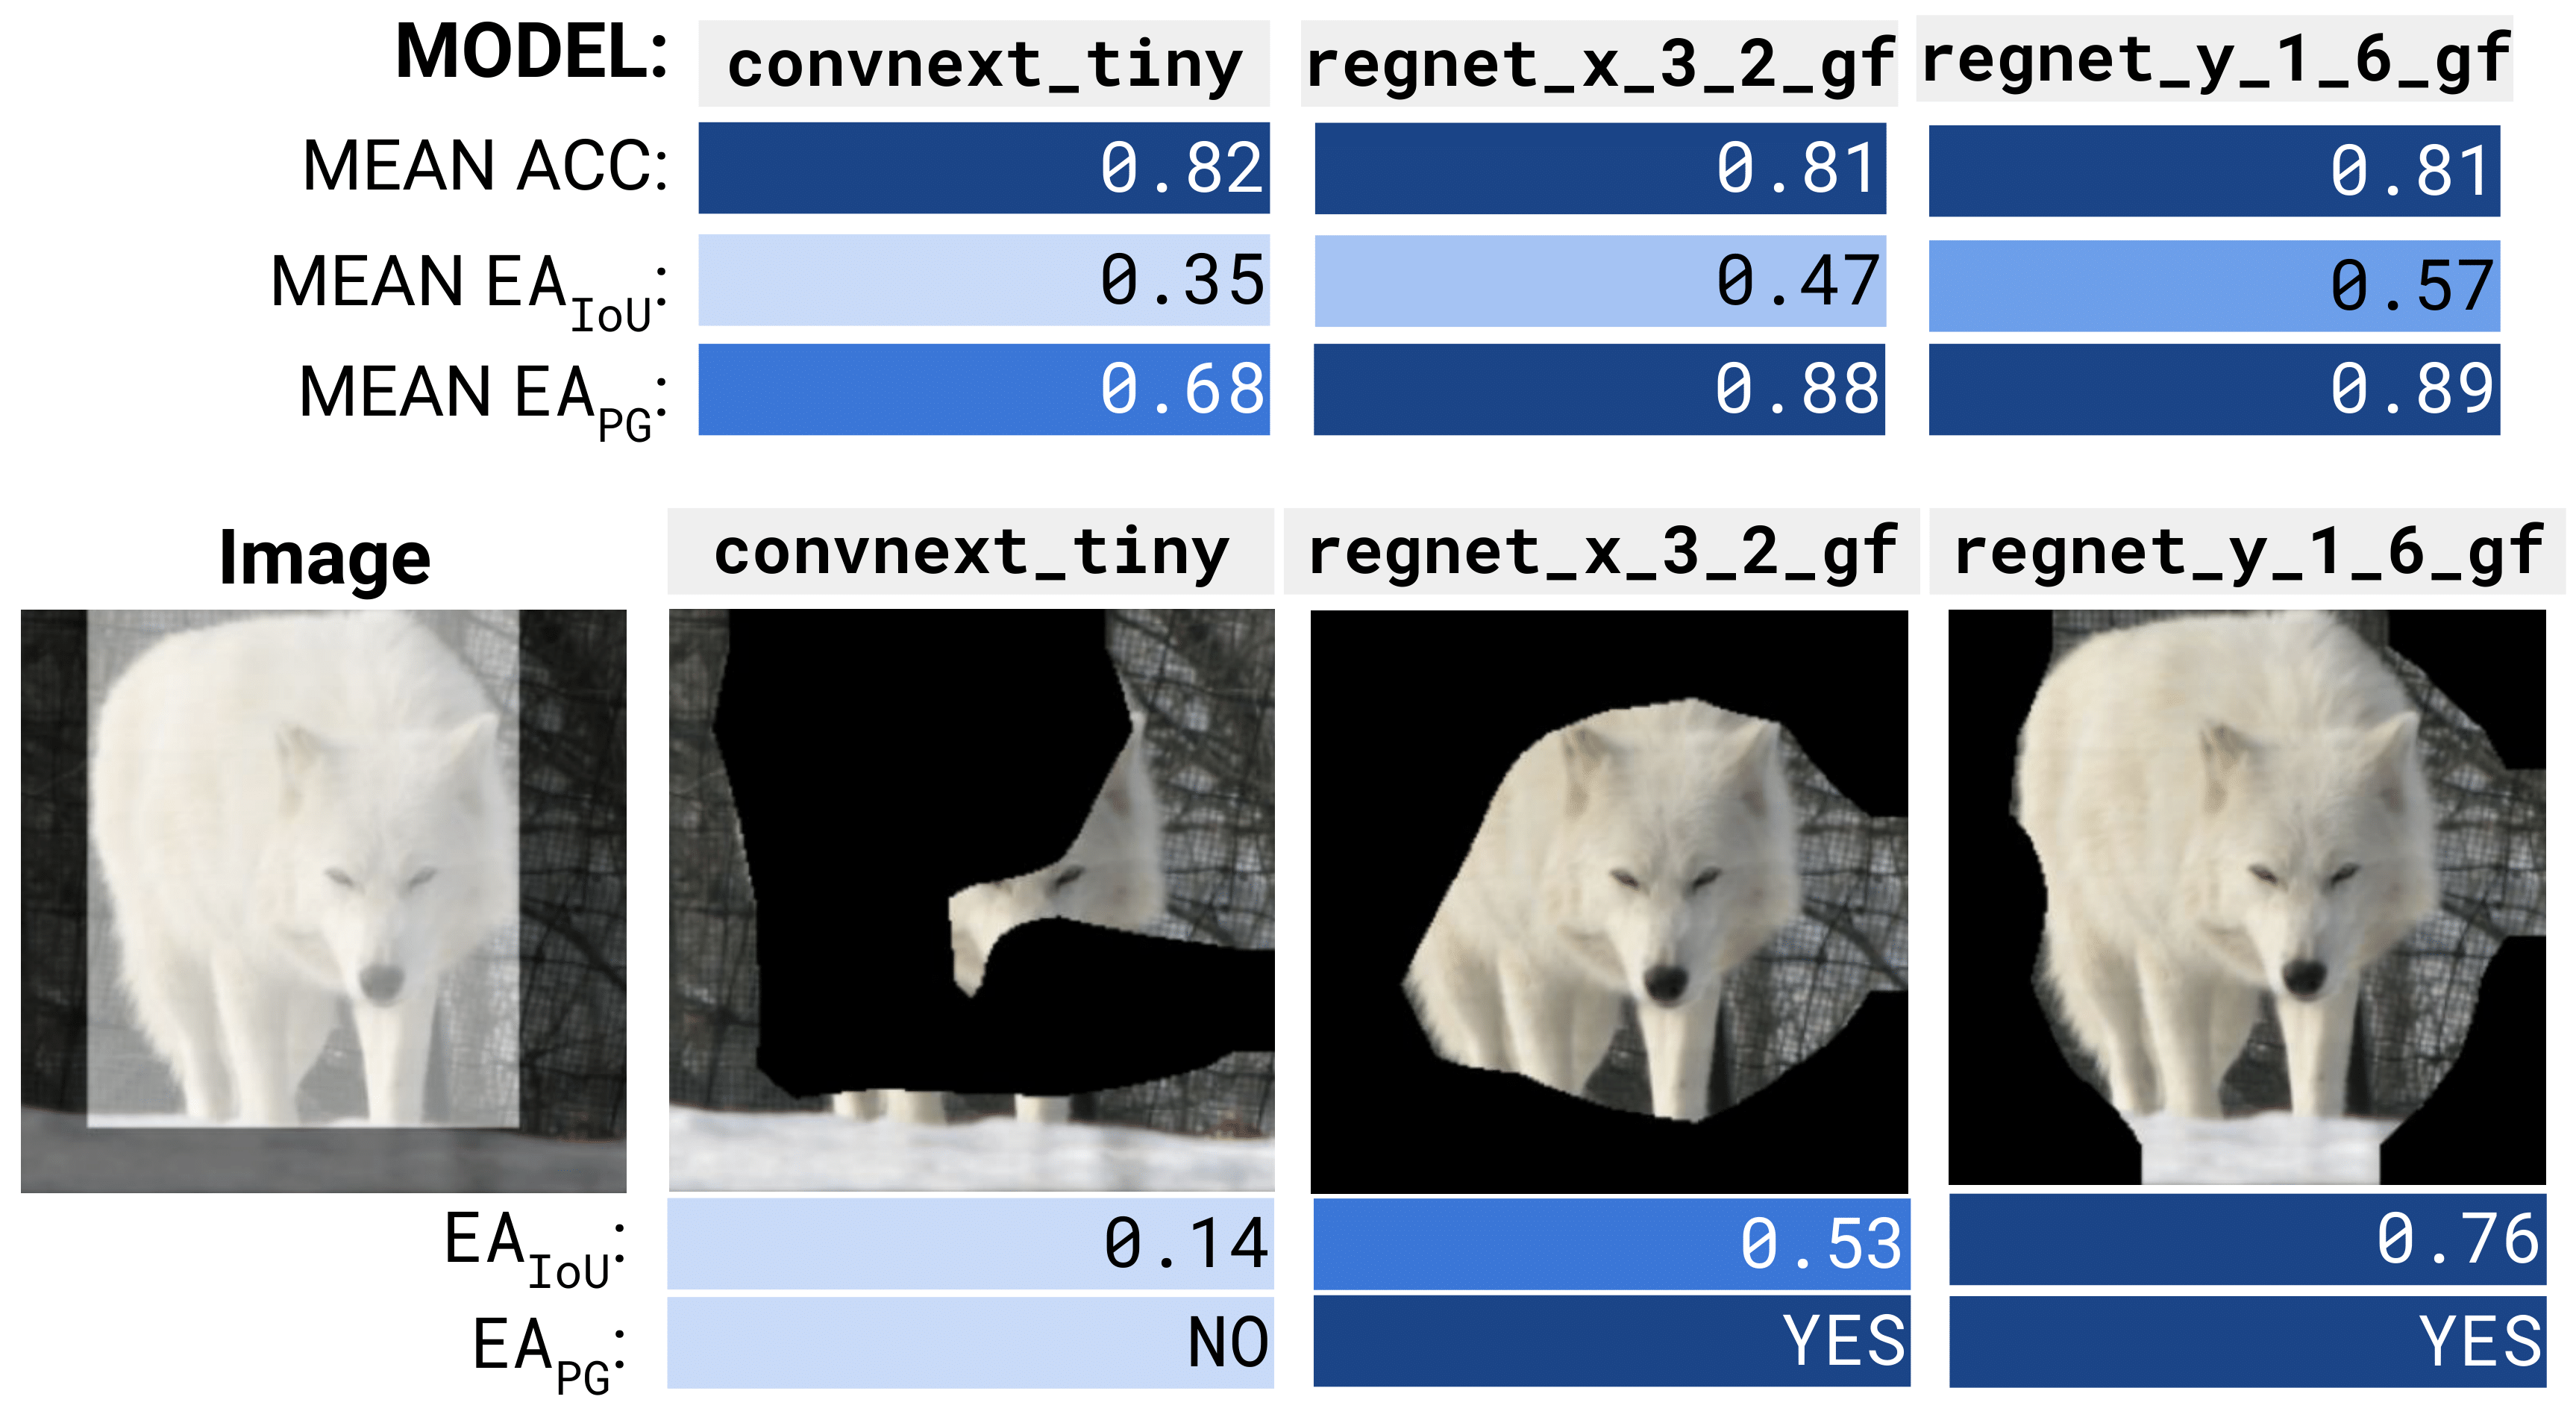
Explanation Alignment
Quantifying the Correctness of Model Reasoning At Scale
Hyemin (Helen) Bang, Angie Boggust, Arvind Satyanarayan
To improve the reliability of machine learning models, researchers have developed metrics to measure the alignment between model saliency and human explanations. Thus far, however, these saliency-based alignment metrics have been used to conduct descriptive analyses and instance-level evaluations of models and saliency methods. To enable evaluative and comparative assessments of model alignment, we extend these metrics to compute explanation alignment—the aggregate agreement between model and human explanations. To compute explanation alignment, we aggregate saliency-based alignment metrics over many model decisions and report the result as a performance metric that quantifies how often model decisions are made for the right reasons. Through experiments on nearly 200 image classification models, multiple saliency methods, and MNIST, CelebA, and ImageNet tasks, we find that explanation alignment automatically identifies spurious correlations, such as model bias, and uncovers behavioral differences between nearly identical models. Further, we characterize the relationship between explanation alignment and model performance, evaluating the factors that impact explanation alignment and how to interpret its results in-practice.
eXCV 2024


★ Bluefish
Composing Diagrams with Declarative Relations
Josh Pollock, Catherine Mei, Grace Huang, Elliot Evans, Daniel Jackson, Arvind Satyanarayan
Diagrams are essential tools for problem-solving and communication as they externalize conceptual structures using spatial relationships. But when picking a diagramming framework, users are faced with a dilemma. They can either use a highly expressive but low-level toolkit, whose API does not match their domain-specific concepts, or select a high-level typology, which offers a recognizable vocabulary but supports a limited range of diagrams. To address this gap, we introduce Bluefish: a diagramming framework inspired by component-based user interface (UI) libraries. Bluefish lets users create diagrams using relations: declarative, composable, and extensible diagram fragments that relax the concept of a UI component. Unlike a component, a relation does not have sole ownership over its children nor does it need to fully specify their layout. To render diagrams, Bluefish extends a traditional tree-based scenegraph to a compound graph that captures both hierarchical and adjacent relationships between nodes. To evaluate our system, we construct a diverse example gallery covering many domains including mathematics, physics, computer science, and even cooking. We show that Bluefish’s relations are effective declarative primitives for diagrams. Bluefish is open source, and we aim to shape it into both a usable tool and a research platform.
ACM UIST 2024
“Customization is Key”
Reconfigurable Content Tokens for Accessible Data Visualizations
Shuli Jones, Isabella Pedraza Pineros, Daniel Hajas, Jonathan Zong, Arvind Satyanarayan
Customization is crucial for making visualizations accessible to blind and low-vision (BLV) people with widely-varying needs. But what makes for usable or useful customization? We identify four design goals for how BLV people should be able to customize screen-reader-accessible visualizations: presence, or what content is included; verbosity, or how concisely content is presented; ordering, or how content is sequenced; and, duration, or how long customizations are active. To meet these goals, we model a customization as a sequence of content tokens, each with a set of adjustable properties. We instantiate our model by extending Olli, an open-source accessible visualization toolkit, with a settings menu and command box for persistent and ephemeral customization respectively. Through a study with 13 BLV participants, we find that customization increases the ease of identifying and remembering information. However, customization also introduces additional complexity, making it more helpful for users familiar with similar tools.
ACM CHI 2024
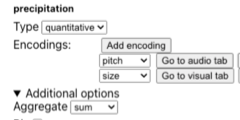
★ Umwelt
Accessible Structured Editing of Multi-Modal Data Representations
Jonathan Zong, Isabella Pedraza Pineros, Mengzhu (Katie) Chen, Daniel Hajas, Arvind Satyanarayan
We present Umwelt, an authoring environment for interactive multimodal data representations. In contrast to prior approaches, which center the visual modality, Umwelt treats visualization, sonification, and textual description as coequal representations: they are all derived from a shared abstract data model, such that no modality is prioritized over the others. To simplify specification, Umwelt evaluates a set of heuristics to generate default multimodal representations that express a dataset’s functional relationships. To support smoothly moving between representations, Umwelt maintains a shared query predicate that is reified across all modalities — for instance, navigating the textual description also highlights the visualization and filters the sonification. In a study with 5 blind / low-vision expert users, we found that Umwelt’s multimodal representations afforded complementary overview and detailed perspectives on a dataset, allowing participants to fluidly shift between task- and representation-oriented ways of thinking.
ACM CHI 2024
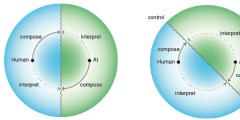
★ Intelligence as Agency
Evaluating the Capacity of Generative AI to Empower or Constrain Human Action
Arvind Satyanarayan, Graham M. Jones
MIT GenAI Impact Papers 2024
Designing for Semi-formal Programming with Foundation Models
Josh Pollock, Ian Arawjo, Caroline Berger, Arvind Satyanarayan
End-user programmers, such as scientists and data analysts, communicate their intent through culturally specific, semi-formal representations like formulas and wireframes. Research on end-user programming inter- faces has sought to democratize programming but has required advances in program synthesis, UI design, and computer vision to support translating a representation to code. As a result, end-users must still fre- quently translate such representations manually. Foundation models like ChatGPT and GPT-4V dramatically lower the cost of designing new programming interfaces by offering much better code synthesis, UI genera- tion, and visual comprehension tools. These advances enable new end-user workflows with more ubiquitous semi-formal representations. We outline the translation work programmers typically perform when translating representations into code, how foundation models help address this problem, and emerging challenges of using foundation models for programming. We posit semi-formal and notational programming as paradigmatic solu- tions to integrating foundation models into programming practice. Articulating a design space of semi-formal representations, we ask how we could design new semi-formal programming environments enabled through foundation models that address their emergent challenges, and sketch “proactive disambiguation” as one solution to bridging gulfs of evaluation and execution.
PLATEAU 2024

2023
Heuristics for Supporting Cooperative Dashboard Design
Vidya Setlur, Michael Correll, Arvind Satyanarayan, Melanie Tory
Dashboards are no longer mere static displays of metrics; through functionality such as interaction and storytelling, they have evolved to support analytic and communicative goals like monitoring and reporting. Existing dashboard design guidelines, however, are often unable to account for this expanded scope as they largely focus on best practices for visual design. In contrast, we frame dashboard design as facilitating an analytical conversation: a cooperative, interactive experience where a user may interact with, reason about, or freely query the underlying data. By drawing on established principles of conversational flow and communication, we define the concept of a cooperative dashboard as one that enables a fruitful and productive analytical conversation, and derive a set of 39 dashboard design heuristics to support effective analytical conversations. To assess the utility of this framing, we asked 52 computer science and engineering graduate students to apply our heuristics to critique and design dashboards as part of an ungraded, opt-in homework assignment. Feedback from participants demonstrates that our heuristics surface new reasons dashboards may fail, % that other guidance does not capture, and encourage a more fluid, supportive, and responsive style of dashboard design. Our approach suggests several compelling directions for future work, including dashboard authoring tools that better anticipate conversational turn-taking, repair, and refinement and extending cooperative principles to other analytical workflows.
Heuristics
Through an iterative process, we distilled 39 heuristics for analytical conversation organized into the five conversation states: initiation, grounding, turn-taking, repair & refinement, and close. A more detailed version of this table with the labeled categories and assigned Gricean Maxims is provided in supplementary material.
Initiation
H1: The dashboard supports specific analytical questions or tasks.
H2: The user should be able to explore the data using the dashboard.
H3: It is clear to the user where they need to start interacting with the dashboard.
H4: The charts in the dashboard support tasks that represent the overall intended goal to the user.
H5: There is a clear reading order within the dashboard and is it logical (e.g., top-down, bottom-up).
H6: The text in the dashboard is legible, easy to read, and useful. The different parts of the chart (e.g. titles, captions, or narration) are well-described.
H7: The charts in the dashboard clearly identify, compare, or summarize a particular aspect of the data.
H8: The layout, placement of charts, and the flow in the visualization should be easy to follow.
H9: The visual systems in place (e.g., a consistent font and color brand) provide guidance in understanding the analysis.
H10: There is a clear and consistent visual style for elements such as titles, axes, and colors.
H11: The conventions used in the dashboard such as icons are easy to understand for the user.
H12: There are consistent rules for the formatting of elements such as gridlines, borders, and supporting ink elements.
H13: The dashboard should disclose any biases. These can include the author’s personal biases, design biases, and/or biases in the data.
H14: The dashboard should communicate where the data came from, and what steps were taken to prepare the data.
Grounding
H15: Charts within the dashboard are at the appropriate level of detail to convey the intended message.
H16: There is a clear presentation of context, theme, and detail as part of the analytical exploration with the dashboard.
H17: The dashboard employs visual symbols and iconography to add meaning to the data being presented or help support the intended message.
H18: If there are icons and symbols in the dashboard, the semantics of their placement and appearance are helpful to communicate patterns in the data. (e.g., changing a plane icon’s location and direction for arrival vs. departure)
H19: The iconography supports or potentially replaces repetitive text directives.
H20: Concepts or metrics (e.g., date formats , time, currency, measurement) are either easily understandable or clearly defined in the dashboard.
H21: There is sufficient contextual information that describes what the dashboard is about.
H22: The charts within the dashboard make sense as an overall composition to help situate or contextualize the user.
H23: The text in the dashboard should emphasize the most salient points of what the visuals in the dashboard convey.
H24: The dashboard communicates a certain style or mood to the user.
Turn-Taking
H25: The dashboard is interactive and supports the user in completing a new analytical task or starting a new line of inquiry.
H26: Tasks in the dashboard should be achieved with minimal friction.
H27: When a user interacts with the dashboard, the dashboard should guide the user with their next step.
H28: The dashboard should update its view based on what is selected, highlighted or filtered by the user.
H29: There are text and visual elements to frame or guide salient information.
H30: There is a clear path and breadcrumbs for user actions within the dashboard.
H31: There are clear strategies employed in the dashboard to mark charts or marks more prominently than others to encourage a user to interact with them, as well as de-emphasize items not relevant to the conversation.
Repair & Refinement
H32: Functional dead end: The dashboard should not freeze, crash, display errors, or otherwise unexpectedly interrupt the user.
H33: Navigational dead end: The dashboard supports interactivity (e.g., filters, search) to help a user navigate between different snapshots of the data being presented.
H34: The dashboard should support input modalities (e.g., natural language interaction, filter widgets, and / or clicks) to answer any analytical question or task.
H35: The user can set or adjust their own definition of concepts or metrics, or otherwise include their own knowledge into the dashboard. (e.g., if a user is interested only in “tall” people, can they set their own definition of “tall”)
Close
H36: There should be a clear takeaway from the dashboard.
H37: The dashboard should not contain any information that distracts from the key takeaway.
H38: The conclusions match what the charts in the dashboard show.
H39: There is adequate evidence that the dashboard is truthful. The dashboard should be able to convince the key takeaway through credibility and trustworthiness (e.g. ethos appeal).
IEEE VIS 2023
Language Model Agents Enable Semi-Formal Programming
Josh Pollock, Arvind Satyanarayan, Daniel Jackson
In the pursuit of malleable programming environments, researchers and practitioners have explored different ways to capture semantic information before a user has fully specified their program. To date, however, these efforts have required system designers to build their formalisms from parts that are either fully formal or else fully opaque to the system. In this paper, we sketch how large language models (LLMs) can enable semi-formal programming. In a semi-formal program, some pieces of information are fully formalized in the host language’s data structure, but other pieces are left informal. Semi-formal information that is semantically meaningful can be executed directly by a language model agent (LMA), be used to guide the user in fully formalizing their program, or serve as a specification for generating a program that captures the user’s intent.
LIVE 2023

VisText
A Benchmark for Semantically Rich Chart Captioning
Benny J. Tang, Angie Boggust, Arvind Satyanarayan
Captions that describe or explain charts help improve recall and comprehension of the depicted data and provide a more accessible medium for people with visual disabilities. However, current approaches for automatically generating such captions struggle to articulate the perceptual or cognitive features that are the hallmark of charts (e.g., complex trends and patterns). In response, we introduce VisText: a dataset of 12,441 pairs of charts and captions that describe the charts’ construction, report key statistics, and identify perceptual and cognitive phenomena. In VisText, a chart is available as three representations: a rasterized image, a backing data table, and a scene graph — a hierarchical representation of a chart’s visual elements akin to a web page’s Document Object Model (DOM). To evaluate the impact of VisText, we fine-tune state-of-the-art language models on our chart captioning task and apply prefix-tuning to produce captions that vary the semantic content they convey. Our models generate coherent, semantically rich captions and perform on par with state-of-the-art chart captioning models across machine translation and text generation metrics. Through qualitative analysis, we identify six broad categories of errors that our models make that can inform future work.
ACL 2023

Saliency Cards
A Framework to Characterize and Compare Saliency Methods
Angie Boggust, Harini Suresh, Hendrik Strobelt, John V. Guttag, Arvind Satyanarayan
Saliency methods are a common class of machine learning interpretability techniques that calculate how important each input feature is to a model’s output. We find that, with the rapid pace of development, users struggle to stay informed of the strengths and limitations of new methods and, thus, choose methods for unprincipled reasons (e.g., popularity). Moreover, despite a corresponding rise in evaluation metrics, existing approaches assume universal desiderata for saliency methods (e.g., faithfulness) that do not account for diverse user needs. In response, we introduce saliency cards: structured documentation of how saliency methods operate and their performance across a battery of evaluative metrics. Through a review of 25 saliency method papers and 33 method evaluations, we identify 10 attributes that users should account for when choosing a method. We group these attributes into three categories that span the process of computing and interpreting saliency: methodology, or how the saliency is calculated; sensitivity, or the relationship between the saliency and the underlying model and data; and, perceptibility, or how an end user ultimately interprets the result. By collating this information, saliency cards allow users to more holistically assess and compare the implications of different methods. Through nine semi-structured interviews with users from various backgrounds, including researchers, radiologists, and computational biologists, we find that saliency cards provide a detailed vocabulary for discussing individual methods and allow for a more systematic selection of task-appropriate methods. Moreover, with saliency cards, we are able to analyze the research landscape in a more structured fashion to identify opportunities for new methods and evaluation metrics for unmet user needs.
ACM FAccT 2023

Tomorrow's Designers, Designing Today
Jonathan Zong, Arvind Satyanarayan
MIT Morningside Academy of Design, May 2023
Kaleidoscope
Semantically-grounded, Context-specific ML Model Evaluation
Harini Suresh, Divya Shanmugam, Tiffany Chen, Annie Bryan, Alexander D'Amour, John V. Guttag, Arvind Satyanarayan
Desired model behavior often differs across contexts (e.g., different geographies, communities, or institutions), but there is little infrastructure to facilitate context-specific evaluations key to deployment decisions and building trust. Here, we present Kaleidoscope, a system for evaluating models in terms of user-driven, domain-relevant concepts. Kaleidoscope’s iterative workflow enables generalizing from a few examples into a larger, diverse set representing an important concept. These example sets can be used to test model outputs or shifts in model behavior in semantically-meaningful ways. For instance, we might construct a “xenophobic comments” set and test that its examples are more likely to be flagged by a content moderation model than a “civil discussion” set. To evaluate Kaleidoscope, we compare it against template- and DSL-based grouping methods, and conduct a usability study with 13 Reddit users testing a content moderation model. We find that Kaleidoscope facilitates iterative, exploratory hypothesis testing across diverse, conceptually-meaningful example sets.
ACM CHI 2023
Deimos
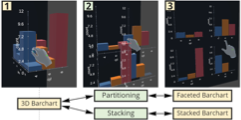
A Grammar of Dynamic Embodied Immersive Visualisation Morphs and Transitions
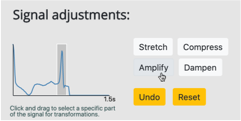
Benjamin Lee, Arvind Satyanarayan, Maxime Cordeil, Arnaud Prouzeau, Bernhard Jenny, Tim Dwyer
We present Deimos, a grammar for specifying dynamic embodied immersive visualisation morphs and transitions. A morph is a collection of animated transitions that are dynamically applied to immersive visualisations at runtime and is conceptually modelled as a state machine. It is comprised of state, transition, and signal specifications. States in a morph are used to generate animation keyframes, with transitions connecting two states together. A transition is controlled by signals, which are composable data streams that can be used to enable embodied interaction techniques. Morphs allow immersive representations of data to transform and change shape through user interaction, facilitating the embodied cognition process. We demonstrate the expressivity of Deimos in an example gallery and evaluate its usability in an expert user study of six immersive analytics researchers. Participants found the grammar to be powerful and expressive, and showed interest in drawing upon Deimos’ concepts and ideas in their own research.
ACM CHI 2023

★ Intelligence Augmentation through the Lens of Interactive Data Visualization
Arvind Satyanarayan
Stanford Human-Computer Interaction Seminar, Apr 2023
2022

Striking a Balance
Reader Takeaways and Preferences when Integrating Text and Charts
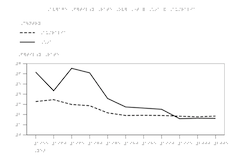
Chase Stokes, Vidya Setlur, Bridget Cogley, Arvind Satyanarayan, Marti A. Hearst
While visualizations are an effective way to represent insights about information, they rarely stand alone. When designing a visualization, text is often added to provide additional context and guidance for the reader. However, there is little experimental evidence to guide designers as to what is the right amount of text to show within a chart, what its qualitative properties should be, and where it should be placed. Prior work also shows variation in personal preferences for charts versus textual representations. In this paper, we explore several research questions about the relative value of textual components of visualizations. 302 participants ranked univariate line charts containing varying amounts of text, ranging from no text (except for the axes) to a written paragraph with no visuals. Participants also described what information they could take away from line charts containing text with varying semantic content. We find that heavily annotated charts were not penalized. In fact, participants preferred the charts with the largest number of textual annotations over charts with fewer annotations or text alone. We also find effects of semantic content. For instance, the text that describes statistical or relational components of a chart leads to more takeaways referring to statistics or relational comparisons than text describing elemental or encoded components. Finally, we find different effects for the semantic levels based on the placement of the text on the chart; some kinds of information are best placed in the title, while others should be placed closer to the data. We compile these results into four chart design guidelines and discuss future implications for the combination of text and charts.
IEEE VIS 2022
Animated Vega-Lite
Unifying Animation with a Grammar of Interactive Graphics
Jonathan Zong*, Josh Pollock*, Dylan Wootton, Arvind Satyanarayan
IEEE VIS 2022

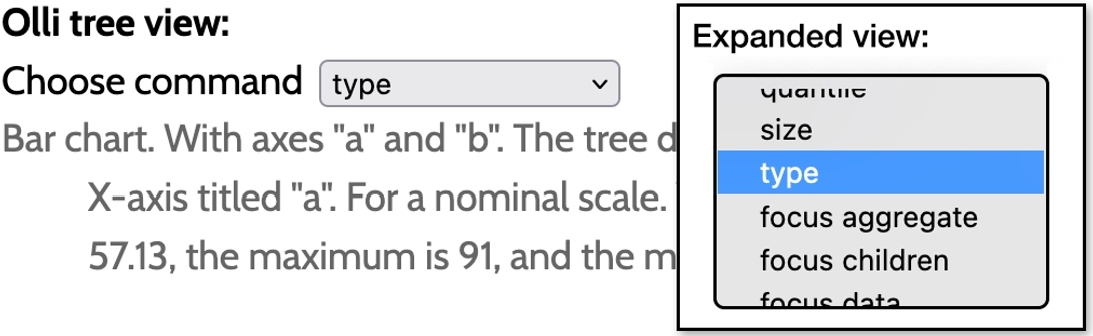
Olli
An Extensible Visualization Library for Screen Reader Accessibility
Matt Blanco, Jonathan Zong, Arvind Satyanarayan
Though recent research has explored the design of rich screen reader visualization experiences, accessible visualizations for blind and low vision users remain rare on the web. While some visualization toolkits offer accessible solutions, toolkit-specific implementations can present idiosyncratic user experiences that limit learnability. We present Olli, an open source library that converts visualizations into a keyboard-navigable structure accessible to screen readers. Using an extensible adapter design pattern, Olli is agnostic to the specific toolkit used to author the visualization. Olli renders a chart as an accessible tree view following the HTML Accessible Rich Internet Applications (ARIA) standard. Olli helps visualization developers easily create accessible visualizations across visualization toolkits.
VIS Posters 2022
Rich Screen Reader Experiences for Accessible Data Visualization
Jonathan Zong*, Crystal Lee*, Alan Lundgard*, JiWoong Jang, Daniel Hajas, Arvind Satyanarayan
EuroVis 2022
Shared Interest
Measuring Human-AI Alignment to Identify Recurring Patterns in Model Behavior
Angie Boggust, Benjamin Hoover, Arvind Satyanarayan, Hendrik Strobelt
Saliency methods—techniques to identify the importance of input features on a model’s output—are a common step in understanding neural network behavior. However, interpreting saliency requires tedious manual inspection to identify and aggregate patterns in model behavior, resulting in ad hoc or cherry-picked analysis. To address these concerns, we present Shared Interest: metrics for comparing model reasoning (via saliency) to human reasoning (via ground truth annotations). By providing quantitative descriptors, Shared Interest enables ranking, sorting, and aggregating inputs, thereby facilitating large-scale systematic analysis of model behavior. We use Shared Interest to identify eight recurring patterns in model behavior, such as cases where contextual features or a subset of ground truth features are most important to the model. Working with representative real-world users, we show how Shared Interest can be used to decide if a model is trustworthy, uncover issues missed in manual analyses, and enable interactive probing.
ACM CHI 2022
★ Varv
Reprogrammable Interactive Software as a Declarative Data Structure
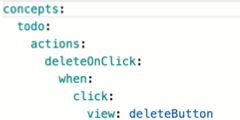
Marcel Borowski, Luke Murray, Rolf Bagge, Janus Bager Kristensen, Arvind Satyanarayan, Clemens Nylandsted Klokmose
Most modern applications are immutable and turn-key despite the acknowledged benefits of empowering users to modify their software. Writing extensible software remains challenging, even for expert programmers. Reprogramming or extending existing software is often laborious or wholly blocked, requiring sophisticated knowledge of application architecture or setting up a development environment. We present Varv, a programming model representing reprogrammable interactive software as a declarative data structure. Varv defines interactive applications as a set of concepts that consist of a schema and actions. Applications in Varv support incremental modification, allowing users to reprogram through addition and selectively suppress, modify, or add behavior. Users can define high-level concepts, creating an abstraction layer and effectively a domain-specific language for their application domain, emphasizing reuse and modification. We demonstrate the reprogramming and collaboration capabilities of Varv in two case studies and illustrate how the event engine allows for extensive tooling support.
ACM CHI 2022
Embedding Comparator
Visualizing Differences in Global Structure and Local Neighborhoods via Small Multiples
Angie Boggust*, Brandon Carter*, Arvind Satyanarayan
Embeddings mapping high-dimensional discrete input to lower-dimensional continuous vector spaces have been widely adopted in machine learning applications as a way to capture domain semantics. Interviewing 13 embedding users across disciplines, we find comparing embeddings is a key task for deployment or downstream analysis but unfolds in a tedious fashion that poorly supports systematic exploration. In response, we present the Embedding Comparator, an interactive system that presents a global comparison of embedding spaces alongside fine-grained inspection of local neighborhoods. It systematically surfaces points of comparison by computing the similarity of the k-nearest neighbors of every embedded object between a pair of spaces. Through case studies across multiple modalities, we demonstrate our system rapidly reveals insights, such as semantic changes following fine-tuning, language changes over time, and differences between seemingly similar models. In evaluations with 15 participants, we find our system accelerates comparisons by shifting from laborious manual specification to browsing and manipulating visualizations.
ACM IUI 2022
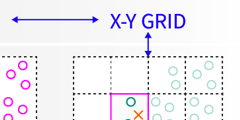
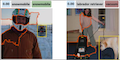
Intuitively Assessing ML Model Reliability through Example-Based Explanations and Editing Model Inputs
Harini Suresh, Kathleen M. Lewis, John V. Guttag, Arvind Satyanarayan
Interpretability methods aim to help users build trust in and understand the capabilities of machine learning models. However, existing approaches often rely on abstract, complex visualizations that poorly map to the task at hand or require non-trivial ML expertise to interpret. Here, we present two interface modules that facilitate intuitively assessing model reliability. To help users better characterize and reason about a model’s uncertainty, we visualize raw and aggregate information about a given input’s nearest neighbors. Using an interactive editor, users can manipulate this input in semantically-meaningful ways, determine the effect on the output, and compare against their prior expectations. We evaluate our approach using an electrocardiogram beat classification case study. Compared to a baseline feature importance interface, we find that 14 physicians are better able to align the model’s uncertainty with domain-relevant factors and build intuition about its capabilities and limitations.
ACM IUI 2022
Teaching Humans When To Defer to a Classifier via Exemplars
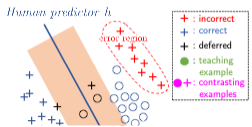
Hussein Mozannar, Arvind Satyanarayan, David Sontag
Expert decision makers are starting to rely on data-driven automated agents to assist them with various tasks. For this collaboration to perform properly, the human decision maker must have a mental model of when and when not to rely on the agent. In this work, we aim to ensure that human decision makers learn a valid mental model of the agent’s strengths and weaknesses. To accomplish this goal, we propose an exemplar-based teaching strategy where humans solve a set of selected examples and with our help generalize from them to the domain. We present a novel parameterization of the human’s mental model of the AI that applies a nearest neighbor rule in local regions surrounding the teaching examples. Using this model, we derive a near-optimal strategy for selecting a representative teaching set. We validate the benefits of our teaching strategy on a multi-hop question answering task with an interpretable AI model using crowd workers. We find that when workers draw the right lessons from the teaching stage, their task performance improves. We furthermore validate our method on a set of synthetic experiments.
AAAI 2022
2021
Design Spaces of Domain-Specific Languages
Comparing and Contrasting Approaches in PL and HCI
Jonathan Zong*, Josh Pollock*, Dylan Wootton, Arvind Satyanarayan
A domain-specific language (DSL) design space describes a collection of related languages via a series of, often orthogonal, dimensions. While PL and HCI researchers have independently developed methods for working with design spaces, the communities have yet to fully benefit from each others’ insights. In pursuit of new approaches informed by both PL and HCI, we first review existing approaches researchers employ to conceptualize, develop, and use design spaces in DSL design across the two disciplines. For example, HCI researchers, when developing interfaces backed by DSLs, often treat the design process as core to their research contributions and theory-building. In PL, researchers have explored formal approaches to design spaces that help automate design space exploration and provide powerful conceptual clarity to language design tradeoffs. We then discuss areas where the two fields share common methods and highlight opportunities for researchers to combine knowledge across PL and HCI.
PLATEAU 2021
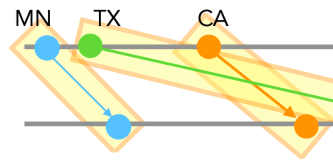
★ Accessible Visualization via Natural Language Descriptions
A Four-Level Model of Semantic Content
Alan Lundgard, Arvind Satyanarayan
IEEE VIS 2021
DIEL
Interactive Visualization Beyond the Here and Now
Yifan Wu, Remco Chang, Joseph M. Hellerstein, Arvind Satyanarayan, Eugene Wu
Interactive visualization design and research have primarily focused on local data and synchronous events. However, for more complex use cases—e.g., remote database access and streaming data sources—developers must grapple with distributed data and asynchronous events. Currently, constructing these use cases is difficult and time-consuming; developers are forced to operationally program low-level details like asynchronous database querying and reactive event handling. This approach is in stark contrast to modern methods for browser-based interactive visualization, which feature high-level declarative specifications. In response, we present DIEL, a declarative framework that supports asynchronous events over distributed data. As in many declarative languages, DIEL developers specify only what data they want, rather than procedural steps for how to assemble it. Uniquely, DIEL models asynchronous events (e.g., user interactions, server responses) as streams of data that are captured in event logs. To specify the state of a visualization at any time, developers write declarative queries over the data and event logs; DIEL compiles and optimizes a corresponding dataflow graph, and automatically generates necessary low-level distributed systems details. We demonstrate DIEL’s performance and expressivity through example interactive visualizations that make diverse use of remote data and asynchronous events. We further evaluate DIEL’s usability using the Cognitive Dimensions of Notations framework, revealing wins such as ease of change, and compromises such as premature commitments.
IEEE VIS 2021

★ Keynote: From Tools to Toolkits: Towards Reusable, Composable, and Reliable Machine Learning Interpretability
Arvind Satyanarayan
ACM KDD Visualization in Data Science (VDS) Workshop, Aug 2021
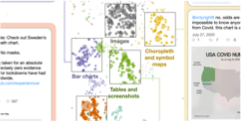
Viral Visualizations
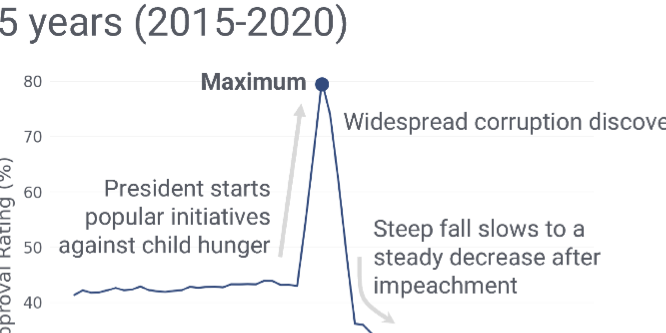
How Coronavirus Skeptics Use Orthodox Data Practices to Promote Unorthodox Science Online
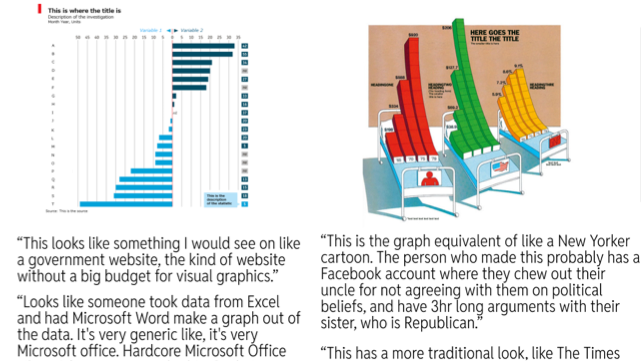
Crystal Lee, Tanya Yang, Gabrielle Inchoco, Graham M. Jones, Arvind Satyanarayan
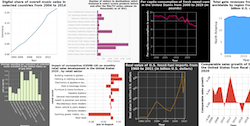
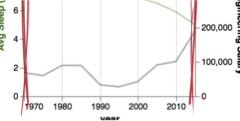
Controversial understandings of the coronavirus pandemic have turned data visualizations into a battleground. Defying public health officials, coronavirus skeptics on US social media spent much of 2020 creating data visualizations showing that the government’s pandemic response was excessive and that the crisis was over. This paper investigates how pandemic visualizations circulated on social media, and shows that people who mistrust the scientific establishment often deploy the same rhetorics of data-driven decision-making used by experts, but to advocate for radical policy changes. Using a quantitative analysis of how visualizations spread on Twitter and an ethnographic approach to analyzing conversations about COVID data on Facebook, we document an epistemological gap that leads pro- and anti-mask groups to draw drastically different inferences from similar data. Ultimately, we argue that the deployment of COVID data visualizations reflect a deeper sociopolitical rift regarding the place of science in public life.
ACM CHI 2021
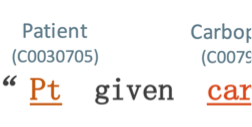
Assessing the Impact of Automated Suggestions on Decision Making
Domain Experts Mediate Model Errors but Take Less Initiative
Ariel Levy, Monica Agrawal, Arvind Satyanarayan, David Sontag
Automated decision support can accelerate tedious tasks as users can focus their attention where it is needed most. However, a key concern is whether users overly trust or cede agency to automation. In this paper, we investigate the effects of introducing automation to annotating clinical texts — a multi-step, error-prone task of identifying clinical concepts (e.g., procedures) in medical notes, and mapping them to labels in a large ontology. We consider two forms of decision aid: recommending which labels to map concepts to, and pre-populating annotation suggestions. Through laboratory studies, we find that 18 clinicians generally build intuition of when to rely on automation and when to exercise their own judgement. However, when presented with fully pre-populated suggestions, these expert users exhibit less agency: accepting improper mentions, and taking less initiative in creating additional annotations. Our findings inform how systems and algorithms should be designed to mitigate the observed issues.
ACM CHI 2021
Beyond Expertise and Roles
A Framework to Characterize the Stakeholders of Interpretable Machine Learning and their Needs
Harini Suresh, Steven R. Gomez, Kevin K. Nam, Arvind Satyanarayan
To ensure accountability and mitigate harm, it is critical that diverse stakeholders can interrogate black-box automated systems and find information that is understandable, relevant, and useful to them. In this paper, we eschew prior expertise- and role-based categorizations of interpretability stakeholders in favor of a more granular framework that decouples stakeholders’ knowledge from their interpretability needs. We characterize stakeholders by their formal, instrumental, and personal knowledge and how it manifests in the contexts of machine learning, the data domain, and the general milieu. We additionally distill a hierarchical typology of stakeholder needs that distinguishes higher-level domain goals from lower-level interpretability tasks. In assessing the descriptive, evaluative, and generative powers of our framework, we find our more nuanced treatment of stakeholders reveals gaps and opportunities in the interpretability literature, adds precision to the design and comparison of user studies, and facilitates a more reflexive approach to conducting this research.
ACM CHI 2021
Lyra 2
Designing Interactive Visualizations by Demonstration
Jonathan Zong, Dhiraj Barnwal, Rupayan Neogy, Arvind Satyanarayan
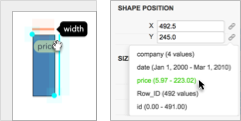
Recent graphical interfaces offer direct manipulation mechanisms for authoring visualizations, but are largely restricted to static output. To author interactive visualizations, users must instead turn to textual specification, but such approaches impose a higher technical burden. To bridge this gap, we introduce Lyra 2, a system that extends a prior visualization design environment with novel methods for authoring interaction techniques by demonstration. Users perform an interaction (e.g., button clicks, drags, or key presses) directly on the visualization they are editing. The system interprets this performance using a set of heuristics and enumerates suggestions of possible interaction designs. These heuristics account for the properties of the interaction (e.g., target and event type) as well as the visualization (e.g., mark and scale types, and multiple views). Interaction design suggestions are displayed as thumbnails; users can preview and test these suggestions, iteratively refine them through additional demonstrations, and finally apply and customize them via property inspectors. We evaluate our approach through a gallery of diverse examples, and evaluate its usability through a first-use study and via an analysis of its cognitive dimensions. We find that, in Lyra 2, interaction design by demonstration enables users to rapidly express a wide range of interactive visualizations.
IEEE InfoVis 2021
2020
★ Critical Reflections on Visualization Authoring Systems
Arvind Satyanarayan, Bongshin Lee, Donghao Ren, Jeffrey Heer, John Stasko, John Thompson, Matthew Brehmer, Zhicheng Liu
An emerging generation of visualization authoring systems support expressive information visualization without textual programming. As they vary in their visualization models, system architectures, and user interfaces, it is challenging to directly compare these systems using traditional evaluative methods. Recognizing the value of contextualizing our decisions in the broader design space, we present critical reflections on three systems we developed-Lyra, Data Illustrator, and Charticulator. This paper surfaces knowledge that would have been daunting within the constituent papers of these three systems. We compare and contrast their (previously unmentioned) limitations and trade-offs between expressivity and learnability. We also reflect on common assumptions that we made during the development of our systems, thereby informing future research directions in visualization authoring systems.
IEEE InfoVis 2020
Representing Real-Time Multi-User Collaboration in Visualizations
Rupayan Neogy, Jonathan Zong, Arvind Satyanarayan
Establishing common ground and maintaining shared awareness amongst participants is a key challenge in collaborative visualization. For real-time collaboration, existing work has primarily focused on synchronizing constituent visualizations — an approach that makes it difficult for users to work independently, or selectively attend to their collaborators’ activity. To address this gap, we introduce a design space for representing synchronous multi-user collaboration in visualizations defined by two orthogonal axes: situatedness, or whether collaborators’ interactions are overlaid on or shown outside of a user’s view, and specificity, or whether collaborators are depicted through abstract, generic representations or through specific means customized for the given visualization. We populate this design space with a variety of examples including generic and custom synchronized cursors, and user legends that collect these cursors together or reproduce collaborators’ views as thumbnails. To build common ground, users can interact with these representations by peeking to take a quick look at a collaborator’s view, tracking to follow along with a collaborator in real-time, and forking to independently explore the visualization based on a collaborator’s work. We present a reference implementation of a wrapper library that converts interactive Vega-Lite charts into collaborative visualizations. We find that our approach affords synchronous collaboration across an expressive range of visual designs and interaction techniques.
IEEE VIS 2020
Visualive
Representing Synchronized Visualization Interactions
Rupayan Neogy, Emily Hu, Arvind Satyanarayan
Visualization researchers have begun exploring real-time visualization synchronization, but the focus has been on the technology supporting such synchronizations, and very little research looks at the front-end. In this paper, we present Visualive, an exploration of the representation of real-time users in the space of a visualization. Visualive represents online users by embedding dynamic color-coded widgets within a visualization, allowing viewers to easily identify remote actions being performed without leaving the context of a visualization. Visualive is an initial dive into merging collaboration and synchronization with data visualization without compromising on the latter experience.
IEEE InfoVis Posters 2020
Data Crafting
Exploring Data through Craft and Play
Nathalie Vladis, Aspen Hopkins, Arvind Satyanarayan
In this full-day workshop, we introduced participants to novel, multi-sensory ways of exploring and visualizing their data through Data Crafting. Data Crafting—in which crafting by hand promotes and produces data communication–facilitates creativity through play; by emphasizing crafting, we sought to make data approachable and to build a space where experts can explore new facets of their data. Our participants thoroughly enjoyed being exposed to this new approach and shared that they were likely to apply what they learned to communicate their research, gain new perspectives on data, and build data literacy at home and in classrooms. Here, we provide instructions on how to recreate this workshop as well as strategies for adapting it to larger audiences and/or shorter sessions. Data Crafting activities can be applied across many domains and in many contexts, as shown by the diverse backgrounds of our participants. From graduate students and post-doctoral researchers to first year business undergraduates and journalist fellows, all participants benefited from attending.
VIS Activities Workshop 2020
★ B2
Bridging Code and Interactive Visualization in Computational Notebooks
Yifan Wu, Joseph M. Hellerstein, Arvind Satyanarayan
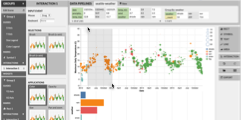
Data scientists have embraced computational notebooks to author analysis code and accompanying visualizations within a single document. Currently, although these media may be interleaved, they remain siloed: interactive visualizations must be manually specified as they are divorced from the analysis provenance expressed via dataframes, while code cells have no access to users’ interactions with visualizations, and hence no way to operate on the results of interaction. To bridge this divide, we present B2, a set of techniques grounded in treating data queries as a shared representation between the code and interactive visualizations. B2 instruments data frames to track the queries expressed in code and synthesize corresponding visualizations. These visualizations are displayed in a dashboard to facilitate interactive analysis. When an interaction occurs, B2 reifies it as a data query and generates a history log in a new code cell. Subsequent cells can use this log to further analyze interaction results and, when marked as reactive, to ensure that code is automatically recomputed when new interaction occurs. In an evaluative study with data scientists, we find that B2 promotes a tighter feedback loop between coding and interacting with visualizations. All participants frequently moved from code to visualization and vice-versa, which facilitated their exploratory data analysis in the notebook.
ACM UIST 2020
★ Keynote: Towards Effective Interaction with Data Visualization
Arvind Satyanarayan
ACM SIGMOD HILDA Workshop, Jun 2020
VisuaLint
Sketchy In Situ Annotations of Chart Construction Errors
Aspen Hopkins, Michael Correll, Arvind Satyanarayan
Chart construction errors, such as truncated axes or inexpressive visual encodings, can hinder reading a visualization, or worse, imply misleading facts about the underlying data. These errors can be caught by critical readings of visualizations, but readers must have a high level of data and design literacy and must be paying close attention. To address this issue, we introduce VisuaLint: a technique for surfacing chart construction errors in situ. Inspired by the ubiquitous red wavy underline that indicates spelling mistakes, visualization elements that contain errors (e.g., axes and legends) are sketchily rendered and accompanied by a concise annotation. VisuaLint is unobtrusive — it does not interfere with reading a visualization — and its direct display establishes a close mapping between erroneous elements and the expression of error. We demonstrate five examples of VisualLint and present the results of a crowdsourced evaluation (N = 62) of its efficacy. These results contribute an empirical baseline proficiency for recognizing chart construction errors, and indicate near-universal difficulty in error identification. We find that people more reliably identify chart construction errors after being shown examples of VisuaLint, and prefer more verbose explanations for unfamiliar or less obvious flaws.
EuroVis 2020

Towards a Dynamic Multiscale Personalized Information Space
Amy Fox, Philip Guo, Clemens Klokmose, Peter Daalsgard, Arvind Satyanarayan, Haijun Xu, James D. Hollan
The historical moment when a person worked in front of a single computer has passed. Computers are now ubiquitous and embedded in virtually every new device and system, connecting our personal and professional activities to ever-expanding information resources with previously unimaginable computational power. Yet with all the increases in capacity, speed, and connectivity, our experiences too often remain difficult, awkward, and frustrating. Even after six decades of design evolution there is little of the naturalness and contextual sensitivity required for convivial interaction with computer-mediated information.
We envision a future in which the existing world of documents and applications is linked to a multiscale personalized information space in which dynamic visual entities behave in accordance with cognitively motivated rules sensitive to tasks, personal and group interaction histories, and context. The heart of the project is to rethink the nature of computer-mediated information as a basis to begin to fully realize the potential of computers to assist information-based activities. This requires challenging fundamental presuppositions that have led to today’s walled gardens and information silos. Our goal is to catalyze an international research community to rethink the nature of information as a basis for radically advancing the human-centered design of information-based work and helping to ensure the future is one of convivial, effective, and humane systems. In this paper, we propose a new view of information systems, discuss cognitive requirements for a human-centered information space, and sketch a research agenda and approach.
Convivial Computing Salon 2020
The Effectiveness of Haptic Properties Under Cognitive Load
An Exploratory Study
Nava Haghighi, Nathalie Vladis, Yuanbo Liu, Arvind Satyanarayan
2020
Self-Interfaces
Utilizing Real-Time Biofeedback in the Wild to Elicit Subconscious Behavior Change
Nava Haghighi, Arvind Satyanarayan
Self-Interfaces are interfaces that intuitively communicate relevant subconscious physiological signals through biofeedback to give the user insight into their behavior and assist them in creating behavior change. The human heartbeat is a good example of an intuitive and relevant haptic biofeedback; does not distract and is only felt when the heart beats fast. In this work, we discuss the design and development of a wearable haptic Self-Interface for Electrodermal Activity (EDA). EDA is a covert physiological signal correlated with high and low arousal affective states. We will evaluate the effectiveness of the EDA Self-Interface based on its intuitiveness, its ability to generate useful insight, whether this insight leads to behavior change, and whether the user can develop an intuitive awareness of their EDA over time when the device is removed. We hope the findings from this study will help us establish a series of guidelines for development of other Self-Interfaces in the future.
ACM TEI WIP 2020
2019

★ Sociotechnical Considerations for Accessible Visualization Design
Alan Lundgard*, Crystal Lee*, Arvind Satyanarayan
Accessibility – the process of designing for people with disabilities (PWD) — is an important but under-explored challenge in the visualization research community. Without careful attention, and if PWD are not included as equal participants throughout the process, there is a danger of perpetuating a vision-first approach to accessible design that marginalizes the lived experience of disability (e.g., by creating overly simplistic “sensory translations” that map visual to non-visual modalities in a one-to-one fashion). In this paper, we present a set of sociotechnical considerations for research in accessible visualization design, drawing on literature in disability studies, tactile information systems, and participatory methods. We identify that using state-of-the-art technologies may introduce more barriers to access than they remove, and that expectations of research novelty may not produce outcomes well-aligned with the needs of disability communities. Instead, to promote a more inclusive design process, we emphasize the importance of clearly communicating goals, following existing accessibility guidelines, and treating PWD as equal participants who are compensated for their specialized skills. To illustrate how these considerations can be applied in practice, we discuss a case study of an inclusive design workshop held in collaboration with the Perkins School for the Blind.
IEEE VIS 2019
Sherlock
A Deep Learning Approach to Semantic Data Type Detection
Madelon Hulsebos, Kevin Hu, Michiel Bakker, Emanuel Zgraggen, Arvind Satyanarayan, Tim Kraska, Çağatay Demiralp, César Hidalgo
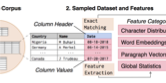
Correctly detecting the semantic type of data columns is crucial for data science tasks such as automated data cleaning, schema matching, and data discovery. Existing data preparation and analysis systems rely on dictionary lookups and regular expression matching to detect semantic types. However, these matching-based approaches often are not robust to dirty data and only detect a limited number of types. We introduce Sherlock, a multi-input deep neural network for detecting semantic types. We train Sherlock on 686,765 data columns retrieved from the VizNet corpus by matching 78 semantic types from DBpedia to column headers. We characterize each matched column with 1,588 features describing the statistical properties, character distributions, word embeddings, and paragraph vectors of column values. Sherlock achieves a support-weighted F1 score of 0.89, exceeding that of machine learning baselines, dictionary and regular expression benchmarks, and the consensus of crowdsourced annotations.
ACM KDD 2019
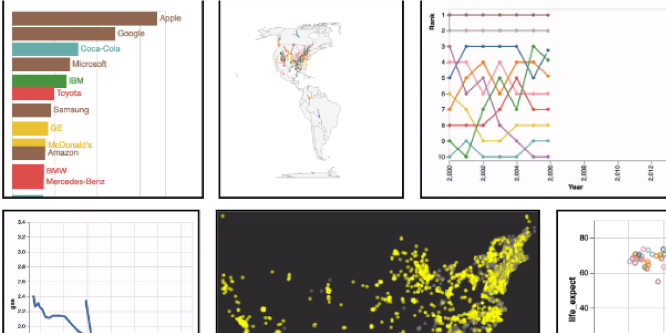
VizNet
Towards A Large-Scale Visualization Learning and Benchmarking Repository
Kevin Hu, Snehalkumar "Neil" S. Gaikwad, Madelon Hulsebos, Michiel Bakker, Emanuel Zgraggen, César Hidalgo, Tim Kraska, Guoliang Li, Arvind Satyanarayan, Çağatay Demiralp
Researchers currently rely on ad hoc datasets to train automated visualization tools and evaluate the effectiveness of visualization designs. These exemplars often lack the characteristics of real-world datasets, and their one-off nature makes it difficult to compare different techniques. In this paper, we present VizNet: a large-scale corpus of over 31 million datasets compiled from open data repositories and online visualization galleries. On average, these datasets comprise 17 records over 3 dimensions and across the corpus, we find 51% of the dimensions record categorical data, 44% quantitative, and only 5% temporal. VizNet provides the necessary common baseline for comparing visualization design techniques, and developing benchmark models and algorithms for automating visual analysis. To demonstrate VizNet’s utility as a platform for conducting online crowdsourced experiments at scale, we replicate a prior study assessing the influence of user task and data distribution on visual encoding effectiveness, and extend it by considering an additional task: outlier detection. To contend with running such studies at scale, we demonstrate how a metric of perceptual effectiveness can be learned from experimental results, and show its predictive power across test datasets.
ACM CHI 2019

★ Visualization: A Petri Dish for Intelligence Augmentation
Arvind Satyanarayan
Harvard Radcliffe Institute, Apr 2019
2018
Designing Cognitively Convivial Physics for Dynamic Visual Information Substrates
James D. Hollan, Arvind Satyanarayan
The historical moment in time when people worked in front of a single computer has passed. Computers are now ubiquitous and are being embedded in virtually every new system, with the internet providing connection to ever-expanding information resources with previously unimaginable computational power. Yet with all the increases in capacity, speed, and connectivity, information-based activities too often remain difficult, awkward, and frustrating. Even after six decades of design evolution there is little of the naturalness and contextual sensitivity needed for convivial interaction with information in the myriad areas now intertwined with computers. We propose a dynamic visual information substrate designed to radically ease information-based tasks by operating in accordance with cognitively motivated physics sensitive to tasks, personal and group interaction histories, and context.
Rethinking Interaction Workshop 2018
Augmenting Code with In Situ Visualizations to Aid Program Understanding
Jane Hoffswell, Arvind Satyanarayan, Jeffrey Heer
Programmers must draw explicit connections between their code and runtime state to properly assess the correctness of their programs. However, debugging tools often decouple the program state from the source code and require explicitly invoked views to bridge the rift between program editing and program understanding. To unobtrusively reveal runtime behavior during both normal execution and debugging, we contribute techniques for visualizing program variables directly within the source code. We describe a design space and placement criteria for embedded visualizations. We evaluate our in situ visualizations in an editor for the Vega visualization grammar. Compared to a baseline development environment, novice Vega users improve their overall task grade by about 2 points when using the in situ visualizations and exhibit significant positive effects on their self-reported speed and accuracy.
ACM CHI 2018
★ The Building Blocks of Interpretability
Chris Olah, Arvind Satyanarayan, Ian Johnson, Shan Carter, Ludwig Schubert, Katherine Ye, Alexander Mordvintsev
Distill 2018
2017
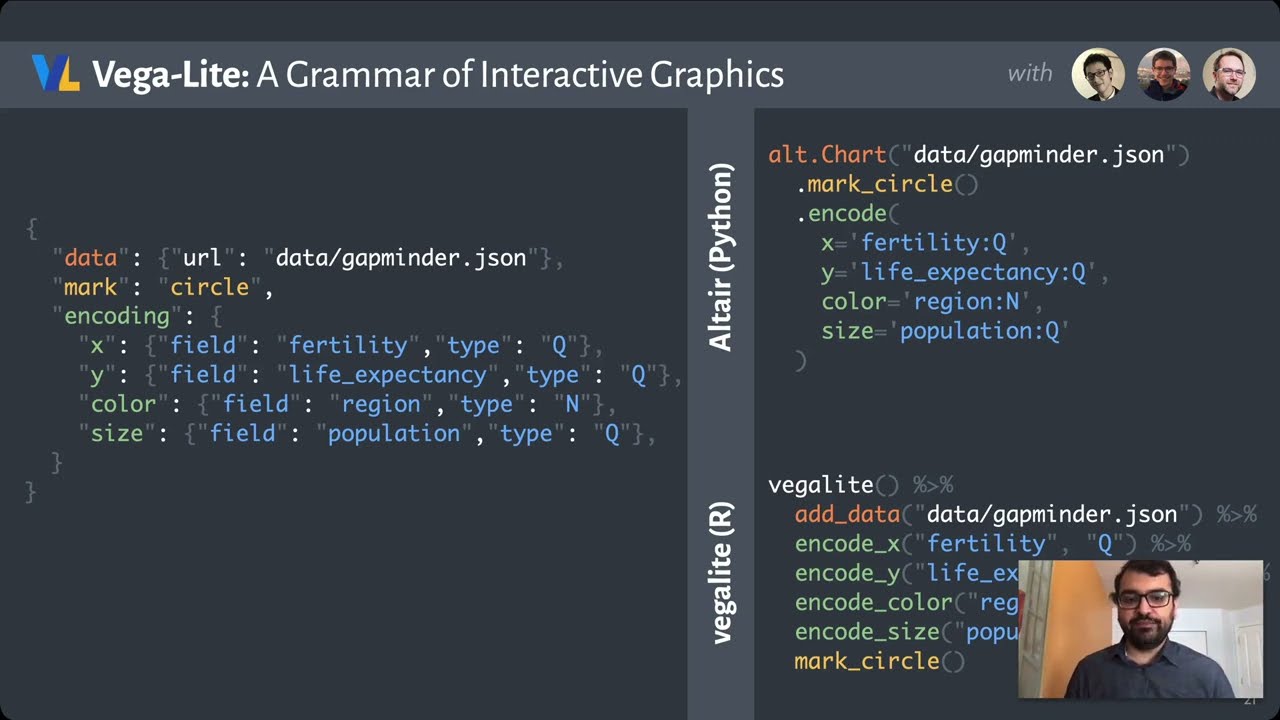
Vega-Lite
A Grammar of Interactive Graphics
Arvind Satyanarayan, Dominik Moritz, Kanit Wongsuphasawat, Jeffrey Heer
We present Vega-Lite, a high-level grammar that enables rapid specification of interactive data visualizations. Vega-Lite combines a traditional grammar of graphics, providing visual encoding rules and a composition algebra for layered and multi-view displays, with a novel grammar of interaction. Users specify interactive semantics by composing selections. In Vega-Lite, a selection is an abstraction that defines input event processing, points of interest, and a predicate function for inclusion testing. Selections parameterize visual encodings by serving as input data, defining scale extents, or by driving conditional logic. The Vega-Lite compiler automatically synthesizes requisite data flow and event handling logic, which users can override for further customization. In contrast to existing reactive specifications, Vega-Lite selections decompose an interaction design into concise, enumerable semantic units. We evaluate Vega-Lite through a range of examples, demonstrating succinct specification of both customized interaction methods and common techniques such as panning, zooming, and linked selection.
IEEE InfoVis 2017
2016
Visual Debugging Techniques for Reactive Data Visualization
Jane Hoffswell, Arvind Satyanarayan, Jeffrey Heer
Interaction is critical to effective visualization, but can be difficult to author and debug due to dependencies among input events, program state, and visual output. Recent advances leverage reactive semantics to support declarative design and avoid the “spaghetti code” of imperative event handlers. While reactive programming improves many aspects of development, textual specifications still fail to convey the complex runtime dynamics. In response, we contribute a set of visual debugging techniques to reveal the runtime behavior of reactive visualizations. A timeline view records input events and dynamic variable updates, allowing designers to replay and inspect the propagation of values step-by-step. On-demand annotations overlay the output visualization to expose relevant state and scale mappings in-situ. Dynamic tables visualize how backing datasets change over time. To evaluate the effectiveness of these techniques, we study how first-time Vega users debug interactions in faulty, unfamiliar specifications; with no prior knowledge, participants were able to accurately trace errors through the specification.
EuroVis 2016
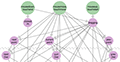
★ Reactive Vega
A Streaming Dataflow Architecture for Declarative Interactive Visualization
Arvind Satyanarayan, Ryan Russell, Jane Hoffswell, Jeffrey Heer
We present Reactive Vega, a system architecture that provides the first robust and comprehensive treatment of declarative visual and interaction design for data visualization. Starting from a single declarative specification, Reactive Vega constructs a dataflow graph in which input data, scene graph elements, and interaction events are all treated as first-class streaming data sources. To support expressive interactive visualizations that may involve time-varying scalar, relational, or hierarchical data, Reactive Vega’s dataflow graph can dynamically re-write itself at runtime by extending or pruning branches in a data-driven fashion. We discuss both compile- and run-time optimizations applied within Reactive Vega, and share the results of benchmark studies that indicate superior interactive performance to both D3 and the original, non-reactive Vega system.
IEEE InfoVis 2016
2014
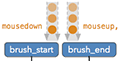
Declarative Interaction Design for Data Visualization
Arvind Satyanarayan, Kanit Wongsuphasawat, Jeffrey Heer
Declarative visualization grammars can accelerate development, facilitate retargeting across platforms, and allow language-level optimizations. However, existing declarative visualization languages are primarily concerned with visual encoding, and rely on imperative event handlers for interactive behaviors. In response, we introduce a model of declarative interaction design for data visualizations. Adopting methods from reactive programming, we model low-level events as composable data streams from which we form higher-level semantic signals. Signals feed predicates and scale inversions, which allow us to generalize interactive selections at the level of item geometry (pixels) into interactive queries over the data domain. Production rules then use these queries to manipulate the visualization’s appearance. To facilitate reuse and sharing, these constructs can be encapsulated as named interactors: standalone, purely declarative specifications of interaction techniques. We assess our model’s feasibility and expressivity by instantiating it with extensions to the Vega visualization grammar. Through a diverse range of examples, we demonstrate coverage over an established taxonomy of visualization interaction techniques.
ACM UIST 2014
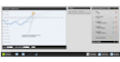
Authoring Narrative Visualizations with Ellipsis
Arvind Satyanarayan, Jeffrey Heer
Data visualization is now a popular medium for journalistic storytelling. However, current visualization tools either lack support for storytelling or require significant technical expertise. Informed by interviews with journalists, we introduce a model of storytelling abstractions that includes state-based scene structure, dynamic annotations and decoupled coordination of multiple visualization components. We instantiate our model in Ellipsis: a system that combines a domain-specific language (DSL) for storytelling with a graphical interface for story authoring. User interactions are automatically translated into statements in the Ellipsis DSL. By enabling storytelling without programming, the Ellipsis interface lowers the threshold for authoring narrative visualizations. We evaluate Ellipsis through example applications and user studies with award-winning journalists. Study participants find Ellipsis to be a valuable prototyping tool that can empower journalists in the creation of interactive narratives.
EuroVis 2014
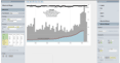
★ Lyra
An Interactive Visualization Design Environment
Arvind Satyanarayan, Jeffrey Heer
We present Lyra, an interactive environment for designing customized visualizations without writing code. Using drag-and-drop interactions, designers can bind data to the properties of graphical marks to author expressive visualization designs. Marks can be moved, rotated and resized using handles; relatively positioned using connectors; and parameterized by data fields using property drop zones. Lyra also provides a data pipeline interface for iterative, visual specification of data transformations and layout algorithms. Visualizations created with Lyra are represented as specifications in Vega, a declarative visualization grammar that enables sharing and reuse. We evaluate Lyra’s expressivity and accessibility through diverse examples and studies with journalists and visualization designers. We find that Lyra enables users to rapidly develop customized visualizations, covering a design space comparable to existing programming-based tools.
EuroVis 2014
2013

The CHI 2013 Interactive Schedule
Arvind Satyanarayan, Daniel Strazzulla, Clemens Klokmose, Michel Beaudouin-Lafon, Wendy Mackay
CHI 2013 offers over 500 separate events including paper presentations, panels, courses, case studies and special interest groups. Given the size of the conference, it is no longer practical to host live summaries of these events. Instead, a 30-second Video Preview summary of each event is available. The CHI’13 Interactive Schedule helps attendees navigate this wealth of video content in order to identify events they would like to attend. It consists of a number of large display screens throughout the conference venue which cycle through a video playlist of events. Attendees can interact with these displays using their mobile devices by either constructing custom video playlists or adding on-screen content to their personal schedule.
ACM CHI EA 2013

Webzeitgeist
Design Mining the Web
Ranjitha Kumar, Arvind Satyanarayan, Cesar Torres, Maxine Lim, Salman Ahmad, Scott R. Klemmer, Jerry O. Talton
Advances in data mining and knowledge discovery have transformed the way Web sites are designed. However, while visual presentation is an intrinsic part of the Web, traditional data mining techniques ignore render-time page structures and their attributes. This paper introduces design mining for the Web: using knowledge discovery techniques to understand design demographics, automate design curation, and support data-driven design tools. This idea is manifest in Webzeitgeist, a platform for large-scale design mining comprising a repository of over 100,000 Web pages and 100 million design elements. This paper describes the principles driving design mining, the implementation of the Webzeitgeist architecture, and the new class of data-driven design applications it enables.
ACM CHI 2013
2012
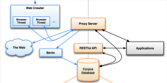
A Platform for Large Scale Machine Learning on Web Design
Arvind Satyanarayan, Maxine Lim, Scott R. Klemmer
The Web is an enormous and diverse repository of design examples. Although people often draw from extant designs to create new ones, existing Web design tools do not facilitate example reuse in a way that captures the scale and diversity of the Web. To do so requires using machine learning techniques to train computational models which can be queried during the design process. In this work-in-progress, we present a platform necessary for doing such large-scale machine learning on Web designs, which consists of a Web crawler and proxy server to harvest and store a lossless and immutable snapshot of the Web; a page segmenter that codifies a page’s visual layout; and an interface for augmenting the segmentations with crowdsourced metadata.
ACM CHI EA 2012

Using Overlays to Support Collaborative Interaction with Display Walls
Arvind Satyanarayan, Nadir Weibel, James D. Hollan
Large-scale display walls, and the high-resolution visualizations they support, promise to become ubiquitous. Natural interaction with them, especially in collaborative environments, is increasingly important and yet remains an on-going challenge. Part of the problem is a resolution mismatch between low-resolution input devices and high-resolution display walls. In addition, enabling concurrent use by multiple users is difficult — for example, how would this large workspace be managed for multiple users and what novel collaborative interactions could occur? In this paper, we present an overlay interface element superimposed on wall-display applications to help constrain interaction, focus attention on subsections of a display wall, and facilitate a collaborative multi-user workflow.
ACM IUI 2012
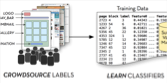
Learning Structural Semantics for the Web
Maxine Lim, Ranjitha Kumar, Arvind Satyanarayan, Cesar Torres, Jerry O. Talton, Scott R. Klemmer
Researchers have long envisioned a Semantic Web, where unstructured Web content is replaced by documents with rich semantic annotations. Unfortunately, this vision has been hampered by the difficulty of acquiring semantic metadata for Web pages. This paper introduces a method for automatically “semantifying” structural page elements: using machine learning to train classifiers that can be applied in a post-hoc fashion. We focus on one popular class of semantic identifiers: those concerned with the structure — or information architecture — of a page. To determine the set of structural semantics to learn and to collect training data for the learning, we gather a large corpus of labeled page elements from a set of online workers. We discuss the results from this collection and demonstrate that our classifiers learn structural semantics in a general way.
Stanford CSTR 2012