Quantifying Visualization Vibes: Measuring Socio-Indexicality at Scale
IEEE Transactions on Visualization & Computer Graphics (Proc. IEEE VIS), 2026 Best Paper Honorable Mention

Amy Fox *
MIT CSAIL
Michelle Morgenstern *
MIT Anthropology
Graham M. Jones
MIT Anthropology

Arvind Satyanarayan
MIT CSAIL
Abstract
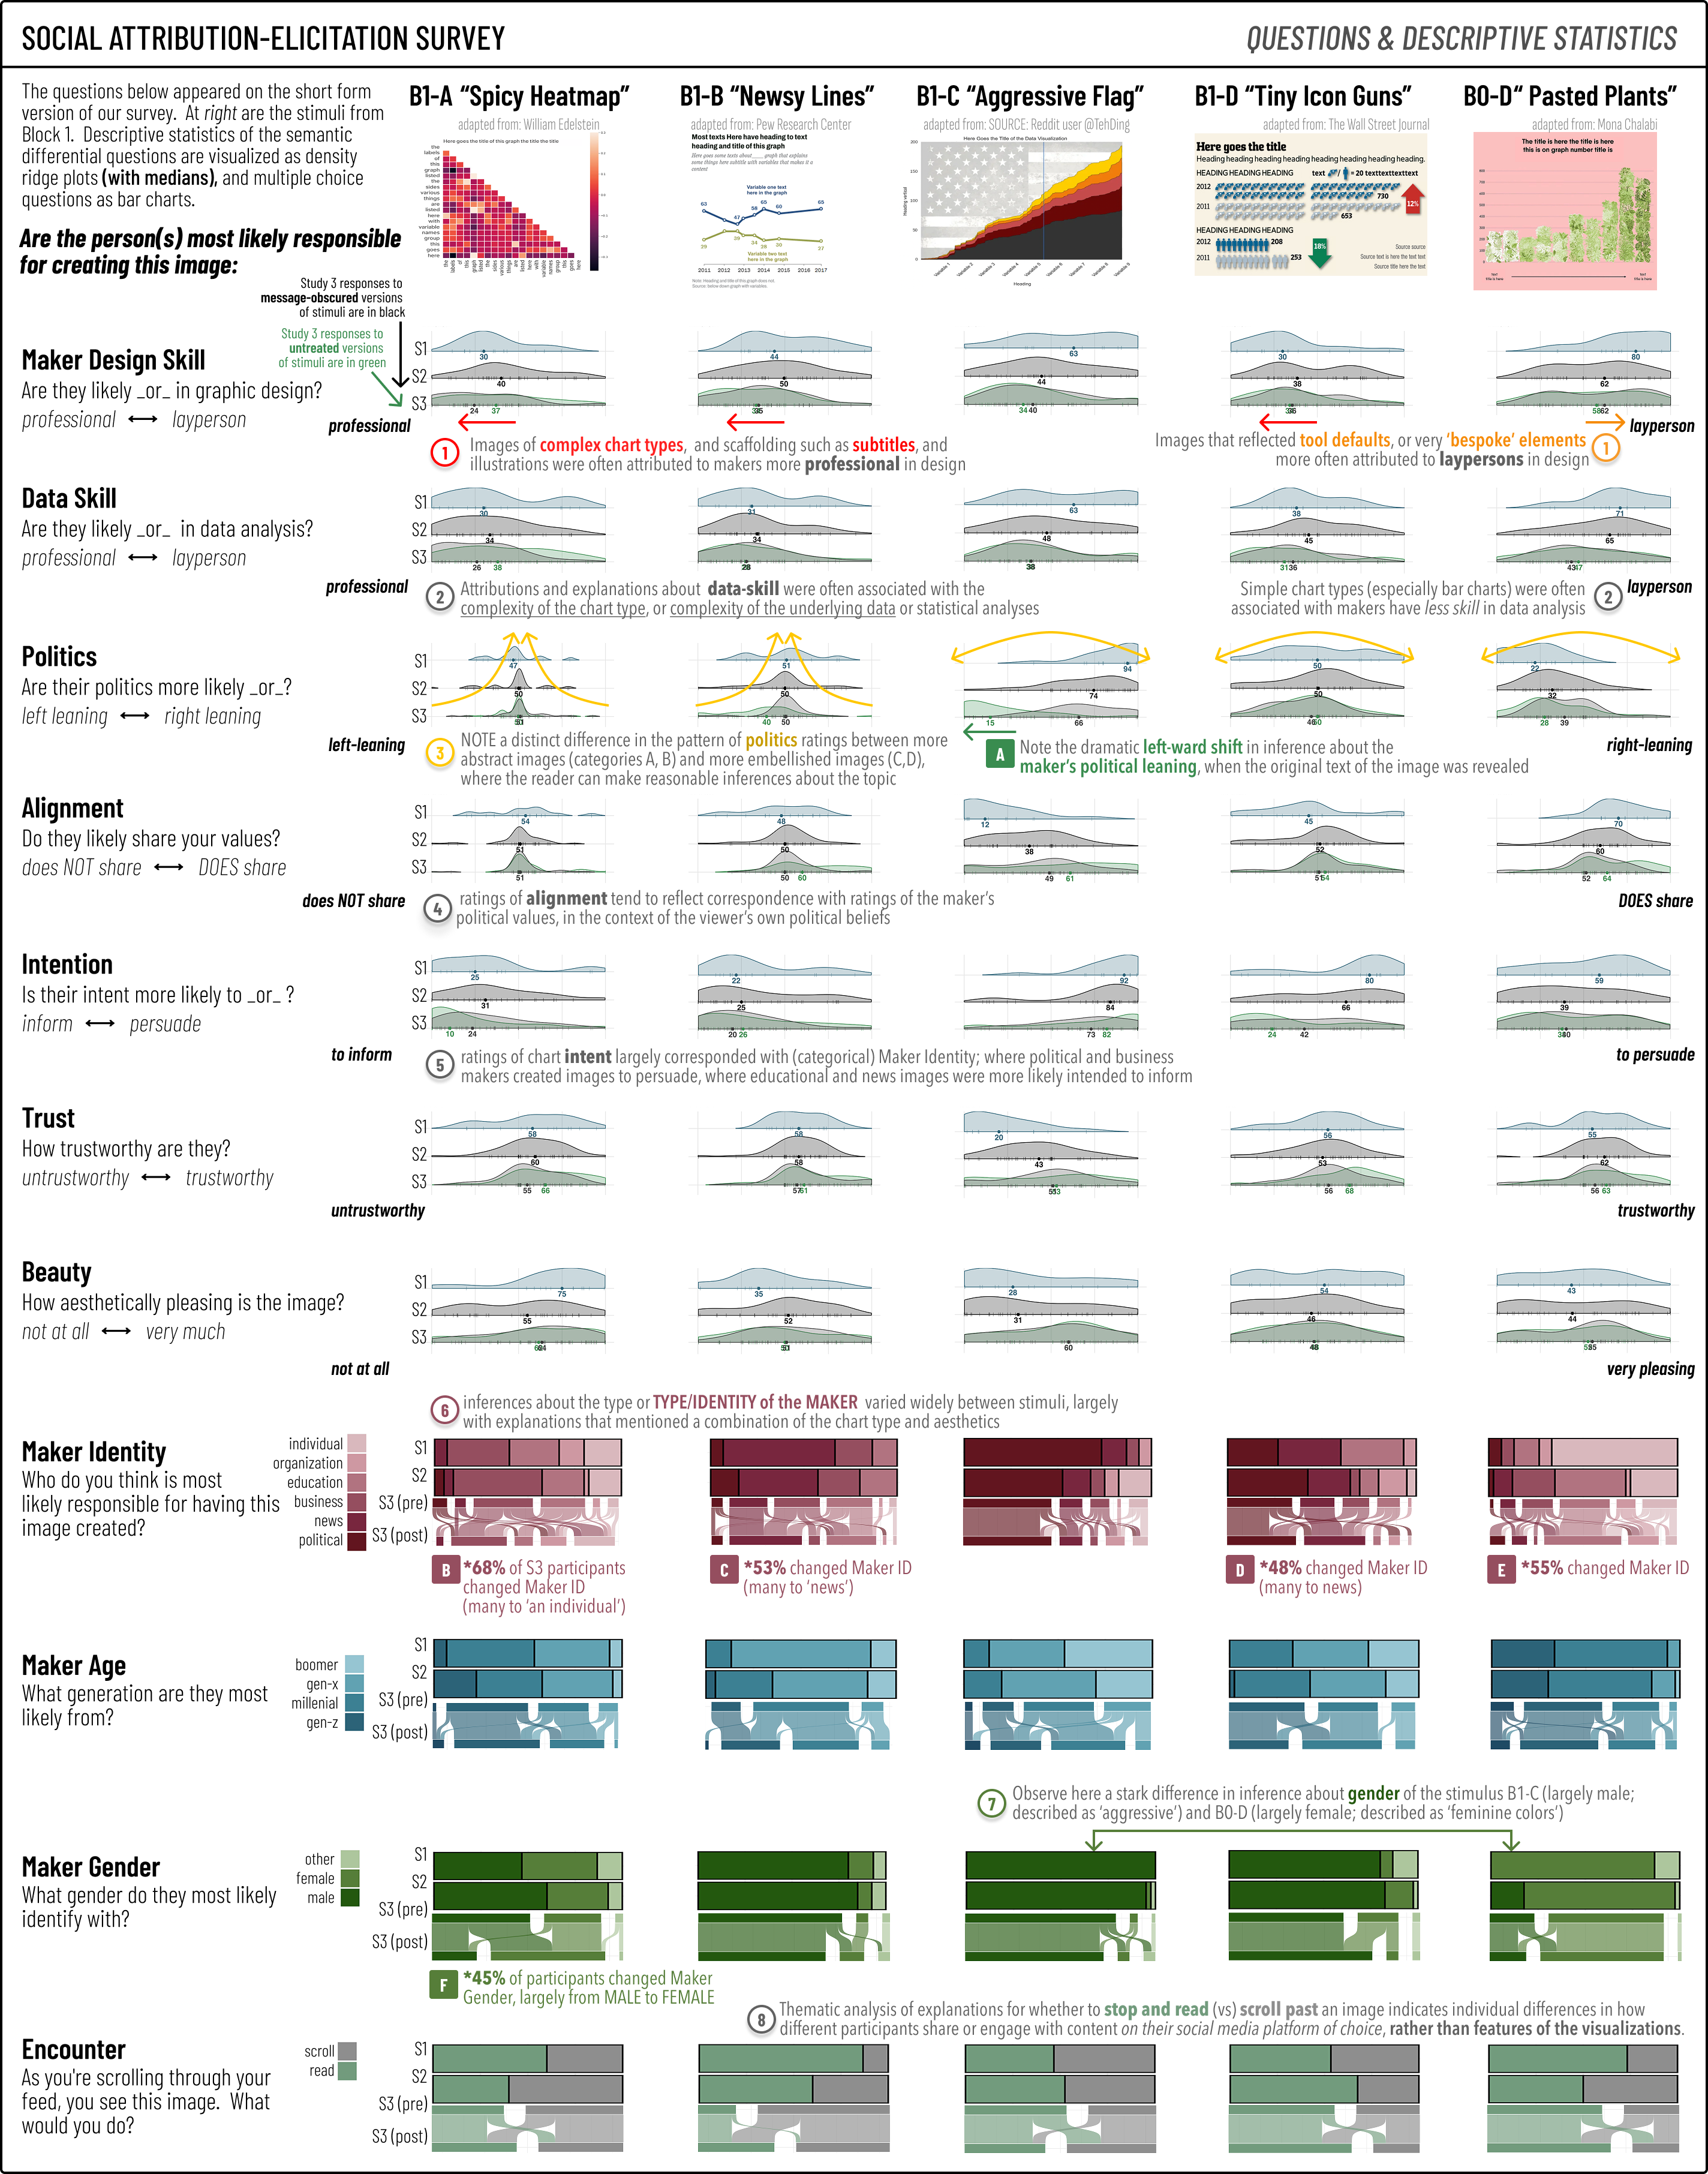
What impressions might readers form with visualizations that go beyond the data they encode? In this paper, we build on recent work that demonstrates the socio-indexical function of visualization, showing that visualizations communicate more than the data they explicitly encode. Bridging this with prior work examining public discourse about visualizations, we contribute an analytic framework for describing inferences about an artifact’s social provenance. Via a series of attribution-elicitation surveys, we offer descriptive evidence that these social inferences: (1) can be studied asynchronously, (2) are not unique to a particular sociocultural group or a function of limited data literacy, and (3) may influence assessments of trust. Further, we demonstrate (4) how design features act in concert with the topic and underlying messages of an artifact’s data to give rise to such ‘beyond-data’ readings. We conclude by discussing the design and research implications of inferences about social provenance, and why we believe broadening the scope of research on human factors in visualization to include sociocultural phenomena can yield actionable design recommendations to address urgent challenges in public data communication.
Bibtex
@article{2026-quantifying-vibes,
  title = {{Quantifying Visualization Vibes: Measuring Socio-Indexicality at Scale}},
  author = {Amy Fox AND Michelle Morgenstern AND Graham M. Jones AND Arvind Satyanarayan},
  journal = {IEEE Transactions on Visualization \& Computer Graphics (Proc. IEEE VIS)},
  year = {2026},
  url = {https://vis.csail.mit.edu/pubs/quantifying-vibes}
}