Benthic: Perceptually Congruent Structures for Accessible Charts and Diagrams
ACM Computers and Accessibility (ASSETS), 2025

Catherine Mei *
MIT CSAIL

Josh Pollock *
MIT CSAIL

Daniel Hajas
University College London

Jonathan Zong
MIT CSAIL

Arvind Satyanarayan
MIT CSAIL
Abstract
Graphical representations—such as charts and diagrams—have a visual structure that communicates the relationship between visual elements. For instance, we might consider two elements to be connected when there is a line or arrow between them, or for there to be a part-to-whole relationship when one element is contained within the other. Yet, existing screen reader solutions rarely surface this structure for blind and low-vision readers. Recent approaches explore hierarchical trees or adjacency graphs, but these structures capture only parts of the visual structure—containment or direct connections, respectively. In response, we present Benthic, a system that supports perceptually congruent screen reader structures, which align screen reader navigation with a graphic’s visual structure. Benthic models graphical representations as hypergraphs: a relaxed tree structure that allows a single hyperedge to connect a parent to a set of children nodes. In doing so, Benthic is able to capture both hierarchical and adjacent visual relationships in a manner that is domain-agnostic and enables fluid (i.e., concise and reversible) traversal. To evaluate Benthic, we conducted a study with 15 blind participants who were asked to explore two kinds of graphical representations that have previously been studied with sighted readers. We find that Benthic’s perceptual congruence enabled flexible, goal-driven exploration and supported participants in building a clear understanding of each diagram’s structure.
Bibtex
@inproceedings{2025-benthic,
  title = {{Benthic: Perceptually Congruent Structures for Accessible Charts and Diagrams}},
  author = {Catherine Mei AND Josh Pollock AND Daniel Hajas AND Jonathan Zong AND Arvind Satyanarayan},
  booktitle = {ACM Computers and Accessibility (ASSETS)},
  year = {2025},
  url = {https://vis.csail.mit.edu/pubs/benthic}
}
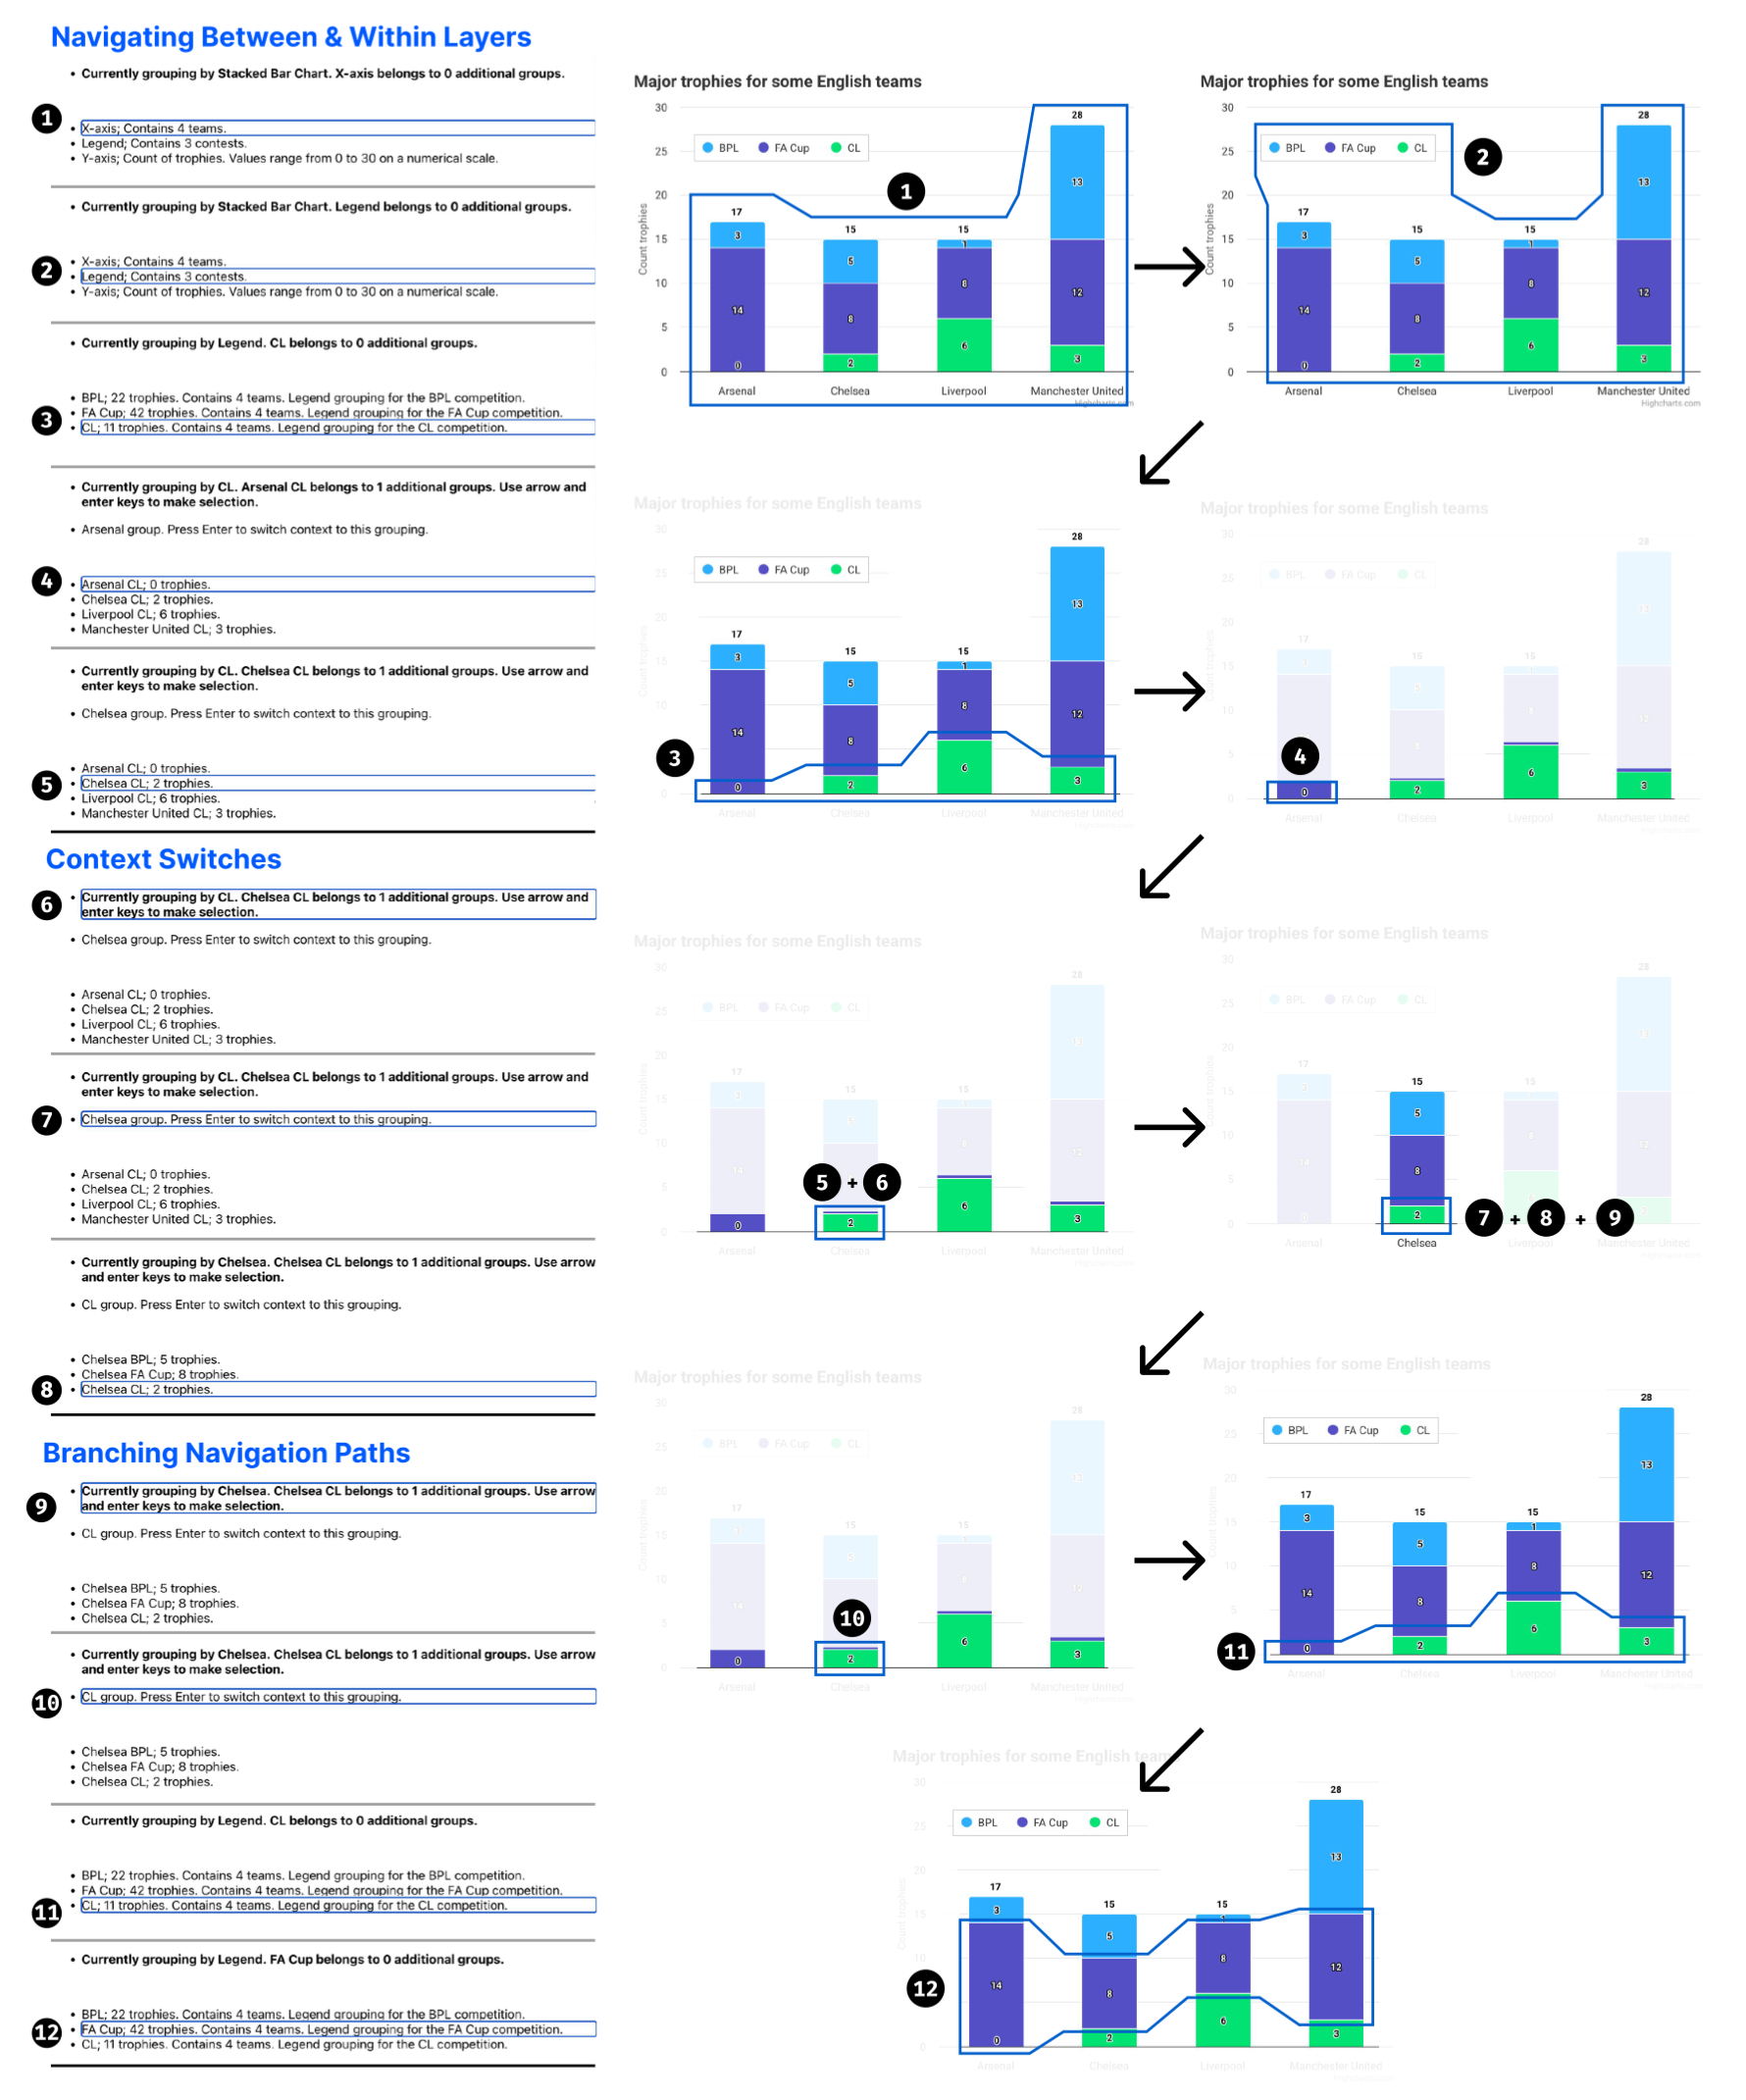
Walkthrough of a usage scenario showing how Marina navigates a stacked bar chart using Benthic. The left-hand side shows 12 interface states as Marina moves between different groupings in the chart and context switches during her exploration. The right-hand side summarizes this sequence using numbered illustrations that correspond to each of the 12 steps. In each illustration, the blue outlined box shows Marina’s current location, while the shaded area highlights the context she is currently exploring. Other parts of the chart are visually faded to reduce distraction. Together, these views show how Benthic reveals structure step by step, helping Marina build understanding as she explores the stacked bar chart.