Pluto: Authoring Semantically Aligned Text and Charts for Data-Driven Communication
ACM Intelligent User Interfaces (IUI), 2025 DOI

Abstract
Textual content (including titles, annotations, and captions) plays a central role in helping readers understand a visualization by emphasizing, contextualizing, or summarizing the depicted data. Yet, existing visualization tools provide limited support for jointly authoring the two modalities of text and visuals such that both convey semantically-rich information and are cohesively integrated. In response, we introduce Pluto, a mixed-initiative authoring system that uses features of a chart’s construction (e.g., visual encodings) as well as any textual descriptions a user may have drafted to make suggestions about the content and presentation of the two modalities. For instance, a user can begin to type out a description and interactively brush a region of interest in the chart, and Pluto will generate a relevant auto-completion of the sentence. Similarly, based on a written description, Pluto may suggest lifting a sentence out as an annotation or the visualization’s title, or may suggest applying a data transformation (e.g., sort) to better align the two modalities. A preliminary user study revealed that Pluto’s recommendations were particularly useful for bootstrapping the authoring process and helped identify different strategies participants adopt when jointly authoring text and charts. Based on study feedback, we discuss design implications for integrating interactive verification features between charts and text, offering control over text verbosity and tone, and enhancing the bidirectional flow in unified text and chart authoring tools.
Bibtex
@inproceedings{2025-pluto,
  title = {{Pluto: Authoring Semantically Aligned Text and Charts for Data-Driven Communication}},
  author = {Arjun Srinivasan AND Vidya Setlur AND Arvind Satyanarayan},
  booktitle = {ACM Intelligent User Interfaces (IUI)},
  year = {2025},
  doi = {10.1145/3708359.3712122},
  url = {https://vis.csail.mit.edu/pubs/pluto}
}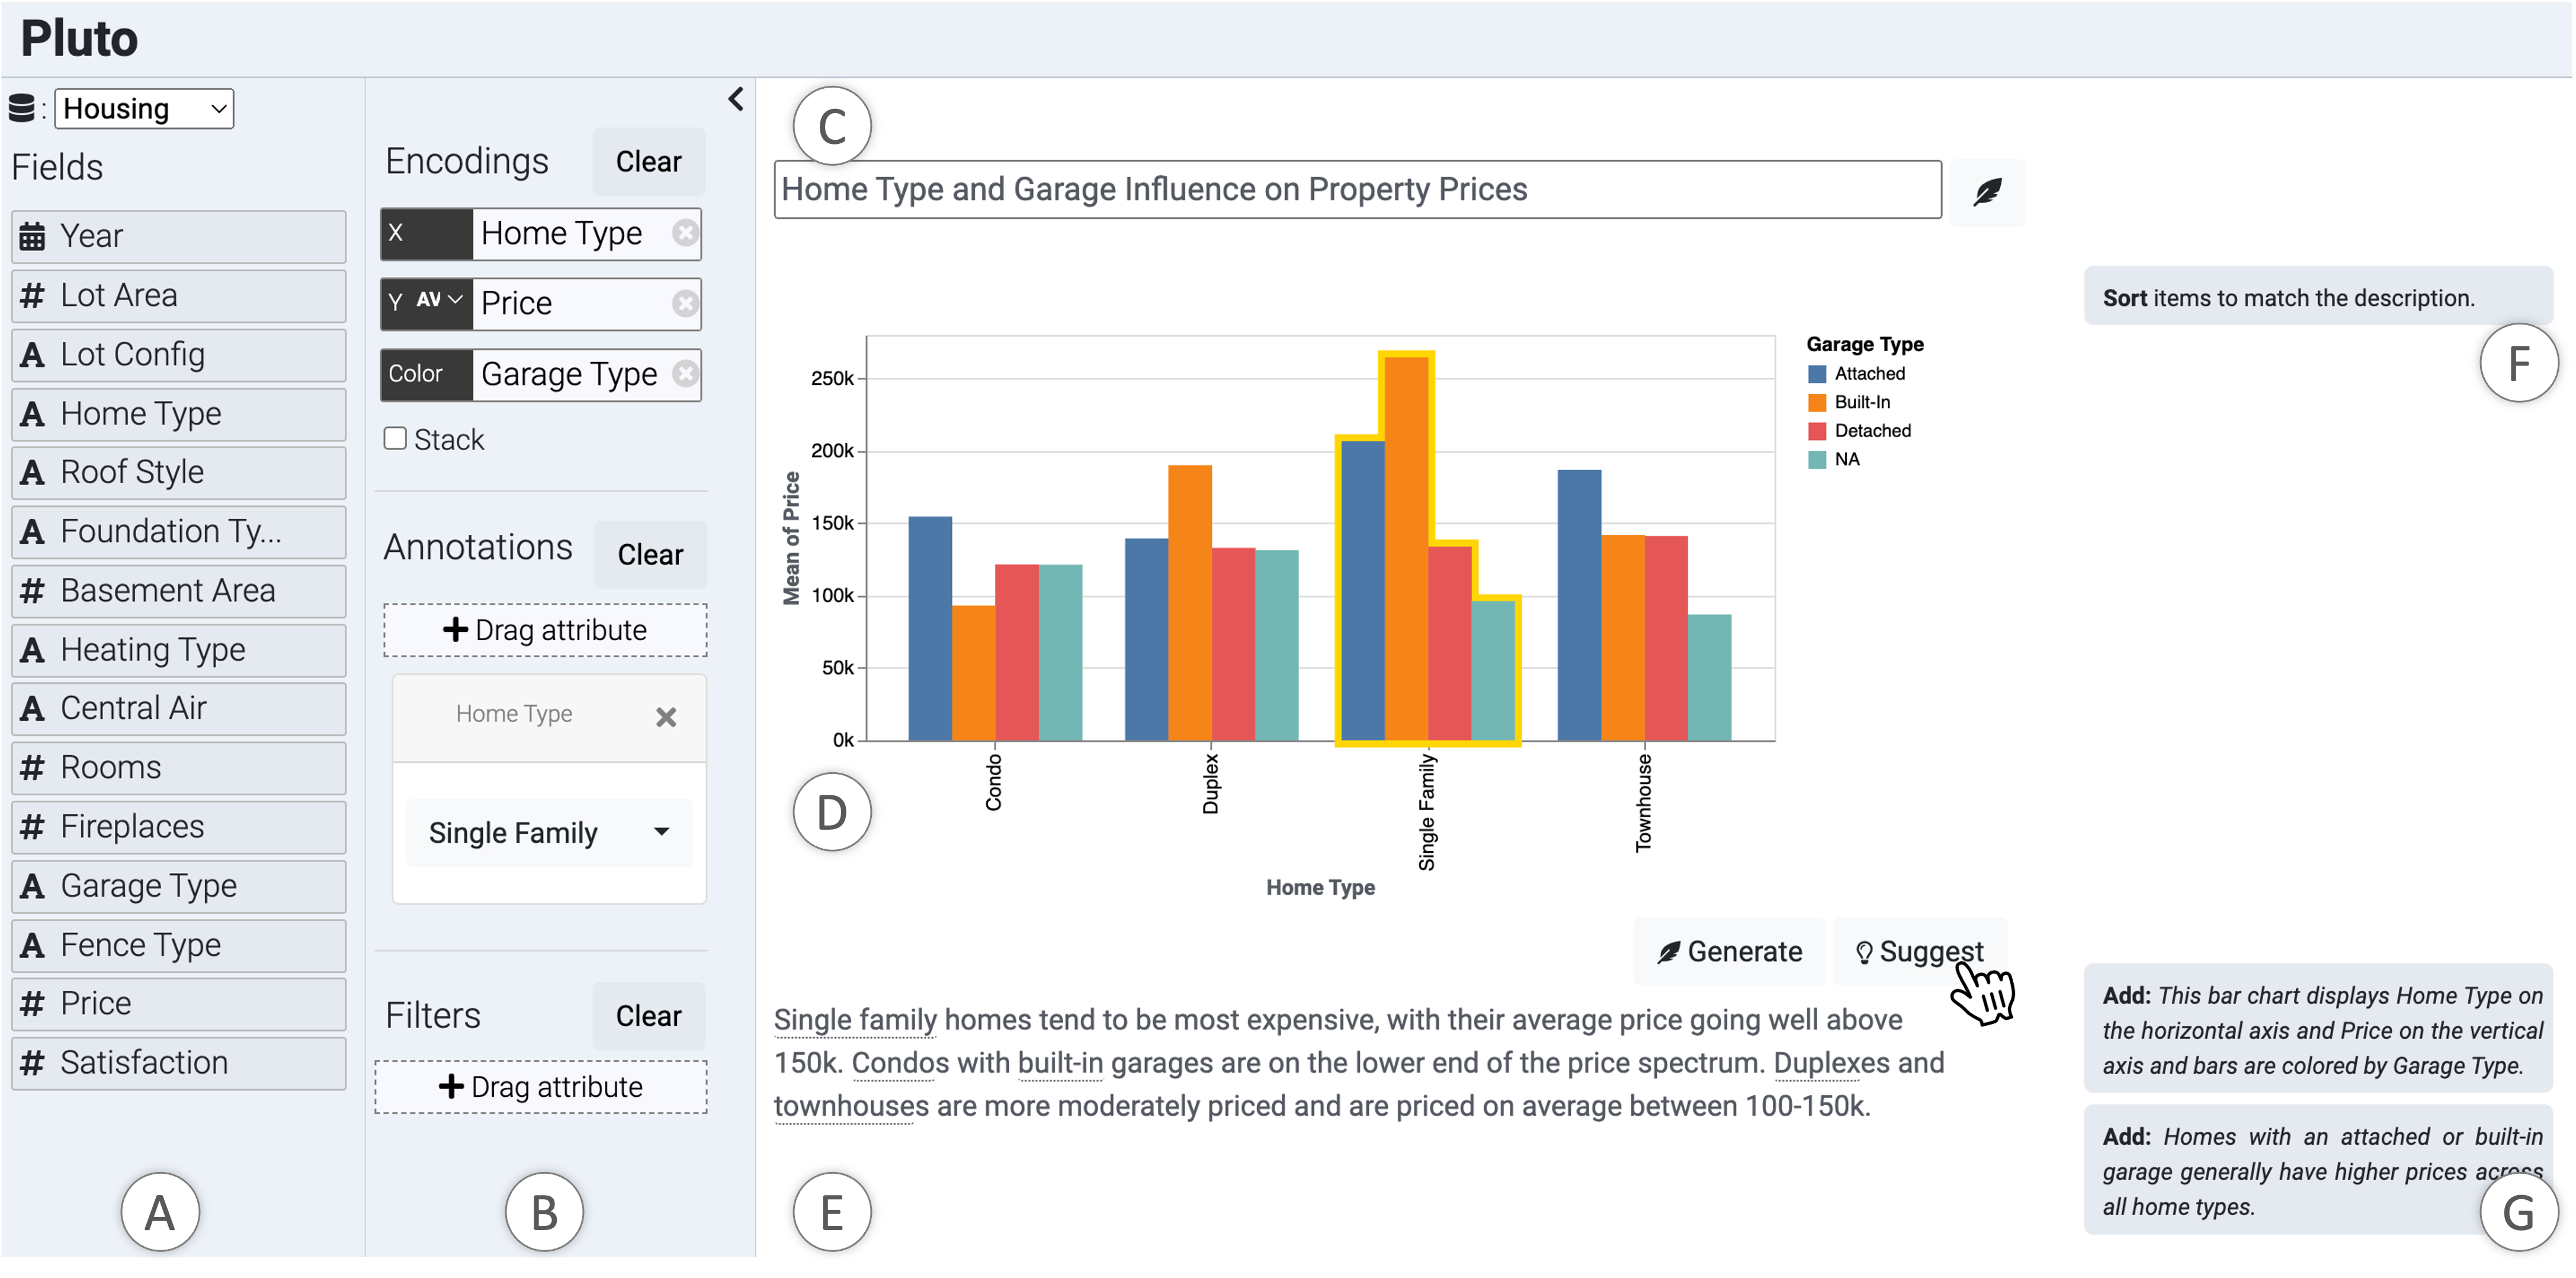
Pluto’s user interface. The key components include a data panel (A), chart editor (B), chart title (C), main chart canvas (D), and a chart description (E). Here, the user has manually entered a description and clicked the 💡 Suggest button to get ideas on improving the chart and text for communication purposes. This results in the system suggesting a title and adding a highlight annotation for `Single Family` homes, while also generating a chart design recommendation (F) and a set of description editing recommendations (G).