Reactive Vega: A Streaming Dataflow Architecture for Declarative Interactive Visualization
IEEE Transactions on Visualization & Computer Graphics (Proc. IEEE InfoVis), 2016 DOI

Arvind Satyanarayan
Stanford University
Ryan Russell
University of Washington
Jane Hoffswell
University of Washington
Jeffrey Heer
University of Washington
Abstract
We present Reactive Vega, a system architecture that provides the first robust and comprehensive treatment of declarative visual and interaction design for data visualization. Starting from a single declarative specification, Reactive Vega constructs a dataflow graph in which input data, scene graph elements, and interaction events are all treated as first-class streaming data sources. To support expressive interactive visualizations that may involve time-varying scalar, relational, or hierarchical data, Reactive Vega’s dataflow graph can dynamically re-write itself at runtime by extending or pruning branches in a data-driven fashion. We discuss both compile- and run-time optimizations applied within Reactive Vega, and share the results of benchmark studies that indicate superior interactive performance to both D3 and the original, non-reactive Vega system.
Bibtex
@article{2016-reactive-vega,
  title = {{Reactive Vega: A Streaming Dataflow Architecture  for Declarative Interactive Visualization}},
  author = {Arvind Satyanarayan AND Ryan Russell AND Jane Hoffswell AND Jeffrey Heer},
  journal = {IEEE Transactions on Visualization \& Computer Graphics (Proc. IEEE InfoVis)},
  year = {2016},
  doi = {10.1109/TVCG.2015.2467091},
  url = {https://vis.csail.mit.edu/pubs/reactive-vega}
}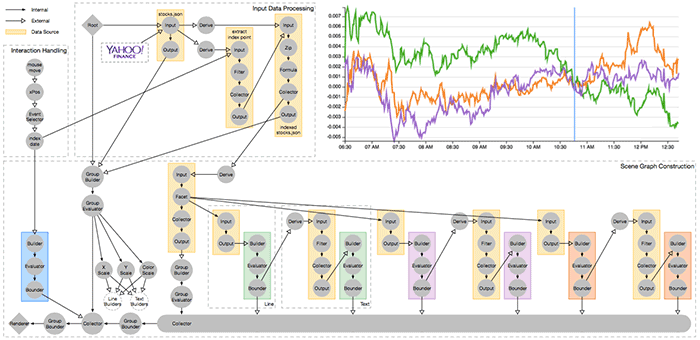
The Reactive Vega dataflow graph created from a declarative specification for a interactive index chart of streaming financial data. As streaming data arrives from the Yahoo! Finance API, or as a user moves their mouse pointer across the chart, an update cycle propagates through the graph and triggers an efficient update and re-render of the visualization.