B2: Bridging Code and Interactive Visualization in Computational Notebooks
ACM User Interface Software & Technology (UIST), 2020 DOI

Abstract
Data scientists have embraced computational notebooks to author analysis code and accompanying visualizations within a single document. Currently, although these media may be interleaved, they remain siloed: interactive visualizations must be manually specified as they are divorced from the analysis provenance expressed via dataframes, while code cells have no access to users’ interactions with visualizations, and hence no way to operate on the results of interaction. To bridge this divide, we present B2, a set of techniques grounded in treating data queries as a shared representation between the code and interactive visualizations. B2 instruments data frames to track the queries expressed in code and synthesize corresponding visualizations. These visualizations are displayed in a dashboard to facilitate interactive analysis. When an interaction occurs, B2 reifies it as a data query and generates a history log in a new code cell. Subsequent cells can use this log to further analyze interaction results and, when marked as reactive, to ensure that code is automatically recomputed when new interaction occurs. In an evaluative study with data scientists, we find that B2 promotes a tighter feedback loop between coding and interacting with visualizations. All participants frequently moved from code to visualization and vice-versa, which facilitated their exploratory data analysis in the notebook.
Bibtex
@inproceedings{2020-b2,
  title = {{B2: Bridging Code and Interactive Visualization in Computational Notebooks}},
  author = {Yifan Wu AND Joseph M. Hellerstein AND Arvind Satyanarayan},
  booktitle = {ACM User Interface Software \& Technology (UIST)},
  year = {2020},
  doi = {10.1145/3379337.3415851},
  url = {https://vis.csail.mit.edu/pubs/b2}
}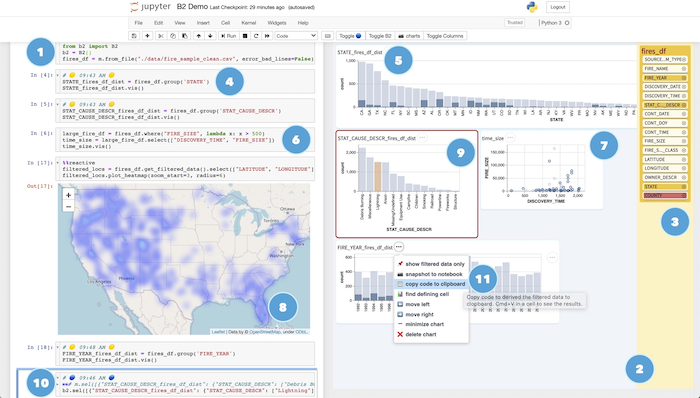
An analyst's workflow with B2. They start by (1) importing the library which creates (2) a resizable dashboard pane to the right of the traditional notebook. The analyst can (3) click on the columns, which creates (4) code that computes and (5) visualizes corresponding distributions. The analyst can also write (6) a custom data frame query to create (7) the scatter plot. (8) B2's <em>reactive cells</em> automatically recompute when new interactions occur on visualizations. Interactions involve (9) <em>selections</em> of marks, which link or cross-filter the other visualizations in the dashboard, and are reified in code cells as either (10) an interaction history or by (11) copying their composed predicate definitions.