
VisuaLint: Sketchy In Situ Annotations of Chart Construction Errors

Computer Graphics Forum (Proc. EuroVis), 2020
DOI: 10.1111/cgf.13975
Abstract
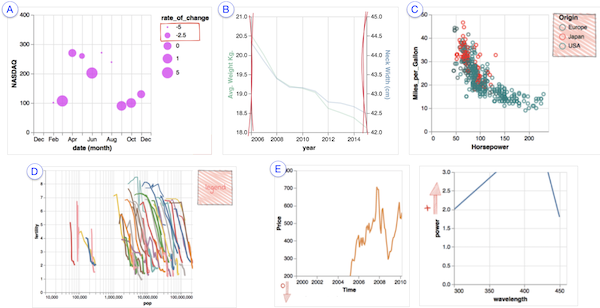
Chart construction errors, such as truncated axes or inexpressive visual encodings, can hinder reading a visualization, or worse, imply misleading facts about the underlying data. These errors can be caught by critical readings of visualizations, but readers must have a high level of data and design literacy and must be paying close attention. To address this issue, we introduce VisuaLint: a technique for surfacing chart construction errors in situ. Inspired by the ubiquitous red wavy underline that indicates spelling mistakes, visualization elements that contain errors (e.g., axes and legends) are sketchily rendered and accompanied by a concise annotation. VisuaLint is unobtrusive — it does not interfere with reading a visualization — and its direct display establishes a close mapping between erroneous elements and the expression of error. We demonstrate five examples of VisualLint and present the results of a crowdsourced evaluation (N = 62) of its efficacy. These results contribute an empirical baseline proficiency for recognizing chart construction errors, and indicate near-universal difficulty in error identification. We find that people more reliably identify chart construction errors after being shown examples of VisuaLint, and prefer more verbose explanations for unfamiliar or less obvious flaws.