
Visual Debugging Techniques for Reactive Data Visualization

Computer Graphics Forum (Proc. EuroVis), 2016
DOI: 10.1111/cgf.12903
Abstract
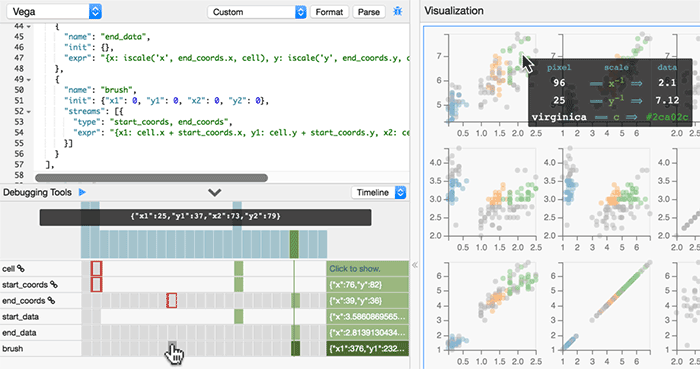
Interaction is critical to effective visualization, but can be difficult to author and debug due to dependencies among input events, program state, and visual output. Recent advances leverage reactive semantics to support declarative design and avoid the “spaghetti code” of imperative event handlers. While reactive programming improves many aspects of development, textual specifications still fail to convey the complex runtime dynamics. In response, we contribute a set of visual debugging techniques to reveal the runtime behavior of reactive visualizations. A timeline view records input events and dynamic variable updates, allowing designers to replay and inspect the propagation of values step-by-step. On-demand annotations overlay the output visualization to expose relevant state and scale mappings in-situ. Dynamic tables visualize how backing datasets change over time. To evaluate the effectiveness of these techniques, we study how first-time Vega users debug interactions in faulty, unfamiliar specifications; with no prior knowledge, participants were able to accurately trace errors through the specification.