


Abstract
We present Animated Vega-Lite, a set of extensions to Vega-Lite that model animated visualizations as time-varying data queries.
In contrast to alternate approaches for specifying animated visualizations, which prize a highly expressive design space, Animated Vega-Lite prioritizes unifying animation with the language’s existing abstractions for static and interactive visualizations to enable authors to smoothly move between or combine these modalities.
Thus, to compose animation with static visualizations, we represent time as an
1 Introduction
Rapid prototyping is critical to the visualization authoring process. When making an explanatory graphic, rapid prototyping allows a visualization author to evaluate candidate designs before committing to refining one in detail. For exploratory data analysis, rapid prototyping is equally key as visualization is just one part of a broader workflow, with analysts focused on producing and analyzing a chart to yield insight or seed further analysis. However, consider the friction of visualizing faceted data: an author might choose between depicting facets as a small multiples display, on-demand via interaction (e.g., dynamic query widgets), or played sequentially via animation. These designs make different trade-offs between time and space and, as a result, research results suggest they afford readers different levels of clarity, time commitment, and visual interest [33]. Despite these differences, the designs express a shared goal — to visualize different groupings of the data — and a visualization author might reasonably expect to be able to easily move between the three to make the most appropriate choice.
Unfortunately, existing visualization toolkits can present a highly viscous [44] specification process when navigating this time-space trade-off.
One class of toolkits supports either interaction or animation, but not both.
Such systems include Vega [38] and Vega-Lite [36] — which offer interaction primitives in the form of
In this paper, we present Animated Vega-Lite: extensions to Vega-Lite to support data-driven animation.
Its design is motivated by the key insight that interaction and animation are parallel concepts (section 3). Whereas interactions transform data (e.g. filtering) and update visual properties (e.g. re-coloring marks) in response to
Animated Vega-Lite offers two abstractions of time that allow animations to compose with Vega-Lite’s existing grammars of static and interactive visualizations (section 4).
From the perspective of interaction, time is an clicks and keypresses produced by a user.
These events drive Vega-Lite time channel for a row or column one.
And, for added customizability, users can always turn a time-as-encoding specification into a time-as-event-stream one.
We implement a prototype compiler that synthesizes a low-level Vega specification with shared reactive logic for interaction and animation (section 5). Following best practices [32], we assess our contribution with multiple evaluation methods. Through a diverse example gallery (section 6), we demonstrate that Animated Vega-Lite covers much of Yi et al.’s interaction taxonomy [51] and Heer & Robertson’s animation taxonomy [11] while preserving Vega-Lite’s low viscosity and systematic generativity. We also interview five expert developers of four existing animated visualization grammars [43, 46, 9, 8, 19, 18] to critically reflect [35] on the tradeoffs, conceptual affordances, and limitations of our system (section 7). We discuss the important role example visualizations play in grammar design and analyze three areas of tradeoffs: the language design process, support for animations within vs. between encodings, and models of animation keyframes.
2 Related Work
Our contribution is motivated by perceptual work on the value of combining interaction and animation, and is informed by the design of existing toolkits for authoring animated data visualizations.
2.1 Animation in Information Visualization
In a classic 2002 paper, Tversky et al. [47] question the efficacy of animated graphics. In reviewing nearly 100 studies comparing static and animated graphics, the authors were unable to find convincing cases where animated charts were strictly superior to static ones. Visualization researchers have since contributed a body of studies that have identified reasons to be both optimistic and cautious about the value of animation in visualization. For instance, several studies have demonstrated advantages when animating chart transitions [11, 17, 6, 4] or directly animating data values to convey uncertainty [12, 16]. However, these studies have also echoed concerns from Tversky et al. that animations are often too complex or fast to be perceived accurately — for instance, Robertson et al. found that animated trend visualizations are outperformed by static small multiples displays [33].
To ameliorate these limitations of animation, Tversky et al. suggest composing animation with interactivity, particularly through techniques that allow reinspection or focusing on subsets of depicted data.
Robertson et al. began to probe this question by testing an interactive alternative alongside the static and animated stimuli — here, clicking an individual mark adds an overlaid line that depicts its trajectory over time.
They find that although participants are no more accurate under this interactive condition, they perform faster when using this visualization for data analysis [33].
In follow-up work, Abukhodair et al. [1] further contextualize Robertson’s results, finding that interactive animation can be effective and significantly more accurate than animation alone when users want to drill down into the data or have specific questions about points of interest.
More recent results are similarly promising: in eye-tracking studies, Greussing et al. [10] find that interactive animated graphics not only received more attention than static or interactive-only equivalents, but these charts also produced higher knowledge acquisition in participants.
The authors believed that the enhanced affects on memory and performance resulted from an increase in engagement and attention on the visualization, which is in line with additional research on attention [3].
Our work is motivated by these results. By providing a
2.2 Authoring Interaction and Animation
In subsection 3.1, we describe the conceptual similarities between Animated Vega-Lite and Functional Reactive Programming (FRP). Moreover, in section 7 we conduct a detailed comparison between Animated Vega-Lite and gganimate [43], Data Animator [46], Gemini/Gemini2 [19, 18], and Canis/CAST [9, 8]. Here, we instead survey other systems for authoring interaction and animation that have informed our approach.
Visualization toolkits such as D3 [2], Plotly [31], and Matplotlib [13] offer a number of facilities for authoring and composing interaction and animation including typologies of techniques (e.g., brushing, hovering, and animation frames) through to event callbacks and transition functions.
Technique typologies can help foster a rapid authoring process, allowing designers to easily instantiate common techniques, but also present a sharp
In contrast, Animated Vega-Lite, like its predecessor, prioritizes concise high-level declarative specification. As section 3 describes, users can make atomic edits (i.e., changing individual keywords, or adding a localized handful of lines of specification code) to rapidly explore designs across the three modalities. The tradeoff, however, is one of expressiveness. Animated Vega-Lite users are limited to composing language primitives; while these primitives are sufficient to broadly cover interaction and animation taxonomies (section 6), their expressive range will necessarily be smaller than their lower-level counterparts.
3 Motivation: Unifying Interaction and Animation
In this section, we discuss similarities between interaction and animation that we observe. These similarities drive our design decisions, allowing us to extend Vega-Lite with only minimal additional language primitives, and yielding a low-viscosity grammar that makes it easy to switch between static, interactive and animated modalities.
| Example technique | Interaction intent [51] | Animation type [11] |
| Conditional encoding | Select | — |
| Panning | Explore | View transformation |
| Zooming | Abstract / Elaborate | View transformation |
| Axis re-scaling | Reconfigure | Substrate transformation |
| Axis sorting | Reconfigure | Ordering |
| Filtering | Filter | Filtering |
| Enter/exit | Explore | Timestep |
| Multi-view | Connect | — |
| Changing encodings | Encode | Visualization change, Data schema change |
3.1 Conceptually Bridging Interaction and Animation
We observe that interaction and animation share conceptual similarities at both low and high levels of abstraction.
At a low level of abstraction, Functional Reactive Programming (FRP) languages like Flapjax [25] and Fran [7], as well as FRP-based visualization toolkits like Vega [37], have shown that interaction and animation can both be modeled as
To analyze conceptual similarities between interaction and animation at a higher-level of abstraction, we look to Yi et al. [51] and Heer and Robertson [11] that taxonomize techniques for each modality respectively.
These taxonomies are defined by drawing on example visualizations, and although they have been defined separately, share many motivating techniques (Table 1).
For example, Heer and Robertson cite panning as an example of
3.2 Low-Viscous Authoring: An Example Usage Scenario
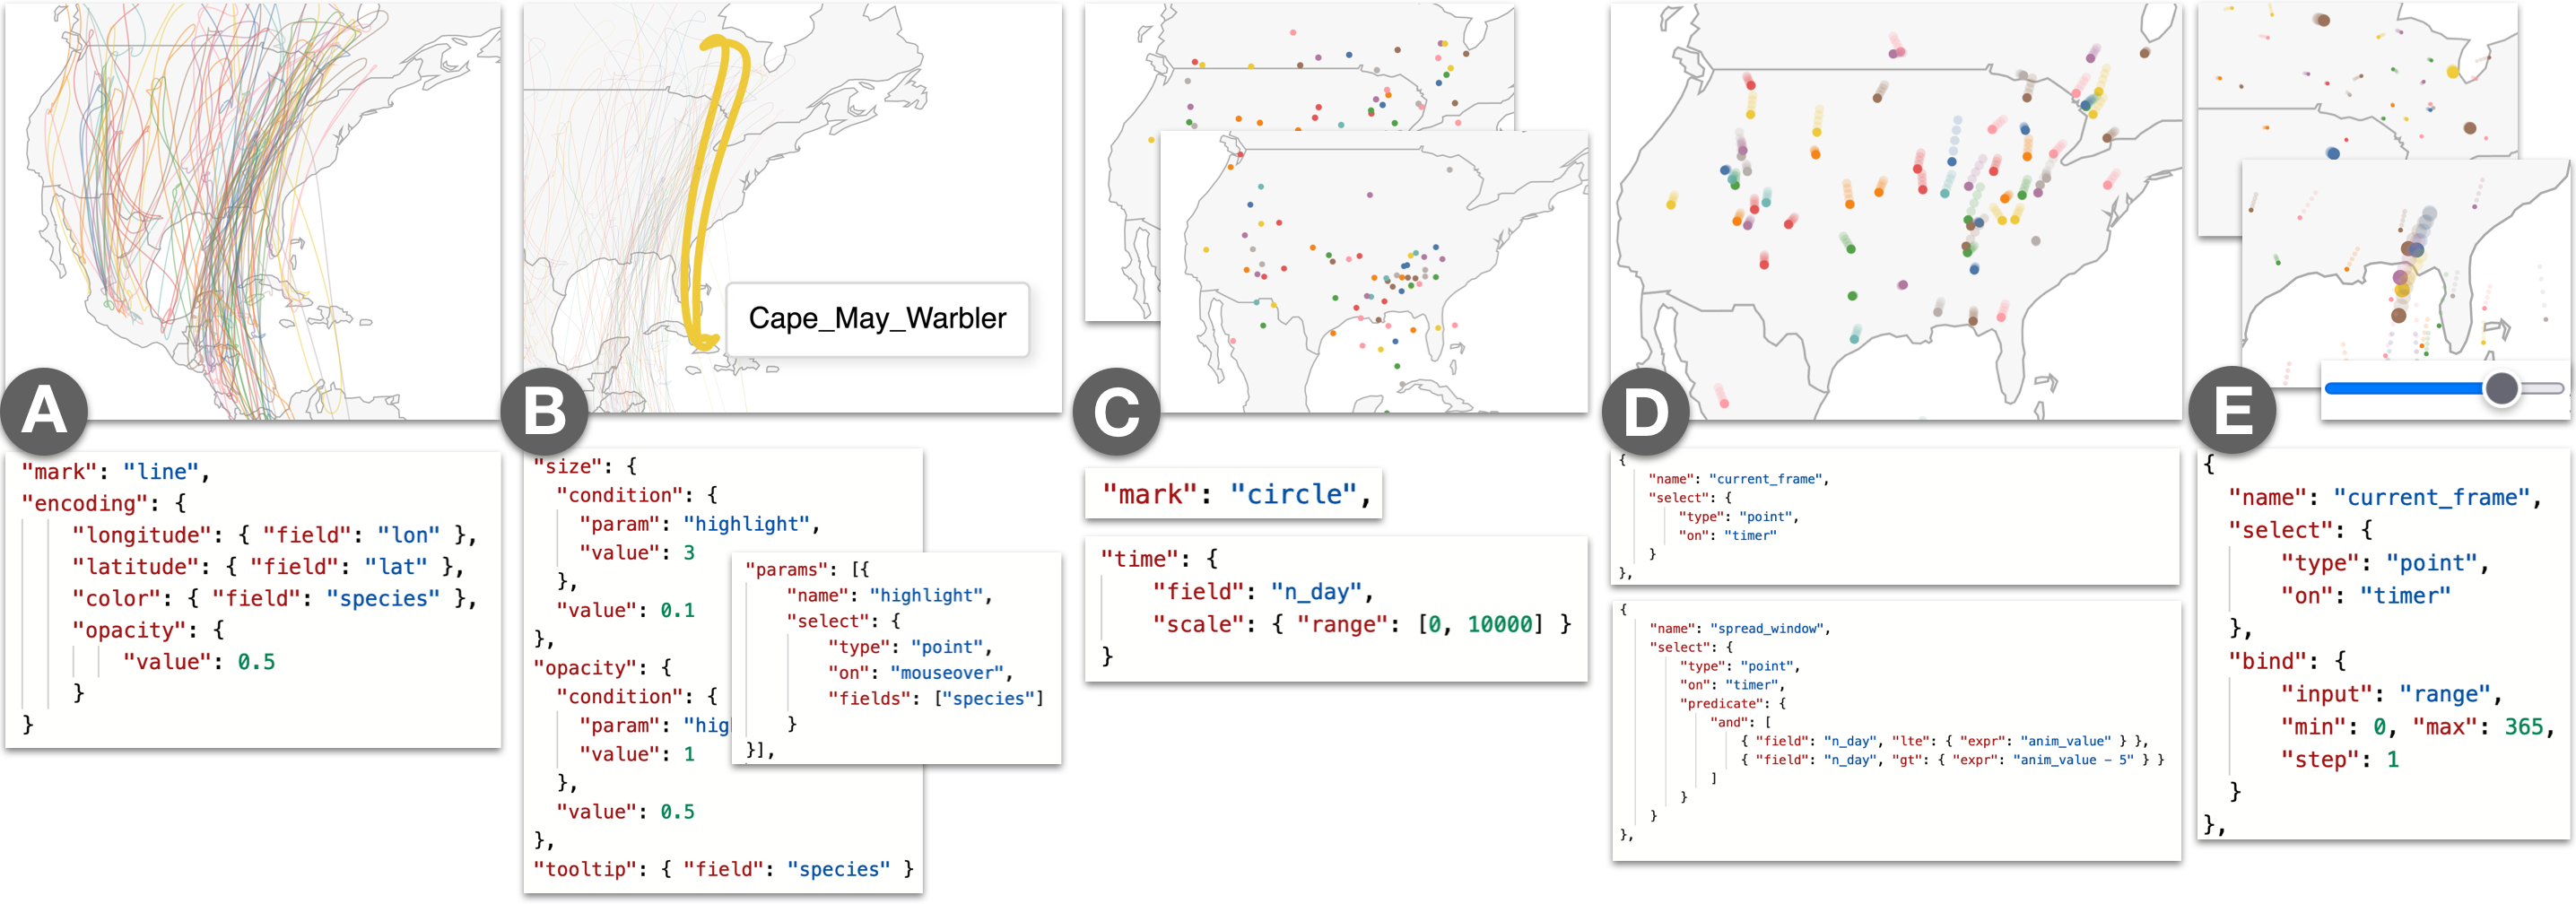
A unified abstraction for static, interaction and animation also promotes a low-viscous authoring process (i.e., being able to easily switch between modalities, or compose them together). To illustrate the affordances of this approach, we present an example walkthrough following Imani, an ornithologist, as she plans a new birdwatching expedition. Imani has a bird migration dataset comprising the average latitudes and longitudes for a variety of bird species, for every day of the year[21]. To ensure a productive trip, Imani wants uncover how migration patterns correspond to different times of the year and geographic regions.
Static (Figure 1A). Imani begins her analysis with a static visualization to get an overview of the dataset. She plots a map, and visualizes migration paths using line marks: each bird species is depicted as a single, uniquely-colored line, connecting the individual daily points along their given latitudes and longitudes. However, Imani is quickly overwhelmed as the size of the dataset produces too many overlapping lines for this static view to be useful, even after adjusting mark opacity.
Interactive (Figure 1B). To pick out individual bird species, and begin a cycle of generating and answering hypotheses, Imani thinks to layer some interactivity on the static display.
She adds a
This interactive view gives Imani a better sense of migration paths. But, to be able to plan her expedition, she needs to understand where different bird species may be on any given day. Until this point, Imani has used vanilla Vega-Lite abstractions. In the subsequent steps, we show how features of Animated Vega-Lite help Imani deepen her analysis.
Time Encoding Channel (Figure 1C).
Imani swaps to a circle mark and maps day (a field that encodes the day of the year from 0 to 365) to the new
Time Event Stream (Figure 1D). Imani, however, is keenly aware that her dataset only contains average values for each species. Birds tend to appear at a given location within a small window of time around the average day in the dataset.
Thus, to ensure she does not make an erroneous conclusion, Imani wants to visualize this variability as a path trail.
To do so, she adds a new point selection named spread_window, which contains a custom
Composing Interaction + Animation (Figure 1E). While watching this path-trail animation, Imani notices that a cluster of birds appear to visit Pensacola, Florida during late March and notes this region as a potential location for her expedition. However, before she lets her colleagues know, she wants to investigate the migration patterns of the birds that come through the area — if these species tend to co-locate in other parts of the world, there is less of a reason for birders to travel to Pensacola specifically. To answer this question, Imani needs finer control over the animation state. She binds the current_frame selection to an interactive range slider, and can now toggle between animating and interactively sliding the day field. She scrubs the slider to the day when the birds pass through Pensacola, and to track these species in the visualization, she modifies the interactive highlight selection to fire on click instead of hover. Imani multi-selects (i.e., clicking with the shift key pressed) the birds that pass through the area, and then scrubs to a different day. Here Imani can see that these birds come from 5 unique nesting sites across the mid-west US to eastern Canada. This is promising as it indicates that these species uniquely overlap in Pensacola, making it a prime viewing destination.
Summary. With Animated Vega-Lite, Imani was able to move between static, interactive, and animated visualizations through a series of atomic edits or otherwise localized changes rather than larger-scale refactoring or restructuring of code. Moreover, we have extended Vega-Lite’s high-level affordances to animation: Imani was able to express animation as data selections and transformations, rather than manipulating keyframes or specifying transition states; and, the Animated Vega-Lite compiler synthesized appropriate defaults and underlying machinery for the animation to unfold correctly. Finally, as Animated Vega-Lite offers a unified abstraction, Imani was able to reuse Vega-Lite’s existing primitives to author mixed interactive-animated visualizations as well as custom techniques without the need for special-purpose functions — e.g., combining animations with on-click highlighting and composing selections with a window data transform to draw trailing marks, rather than using a shadow function as with gganimate.
4 A Grammar of Animation in Vega-Lite
In Animated Vega-Lite, users specify animation using a
4.1 Time Encoding Channel
In Vega-Lite, encodings determine how data values map to the visual properties of a mark (also known as channels).
Vega-Lite includes two channels for spatial position, x and y.
Animated Vega-Lite adds a new channel for temporal position, called time.
A user specifies a time encoding by providing a field property, which is a string of the name of a data column.
The field can be any measure type with a sort order (quantitative, temporal, ordinal), and does not necessarily need to represent a timestamp.
The system uses distinct values from this column to group data rows into temporal facets called
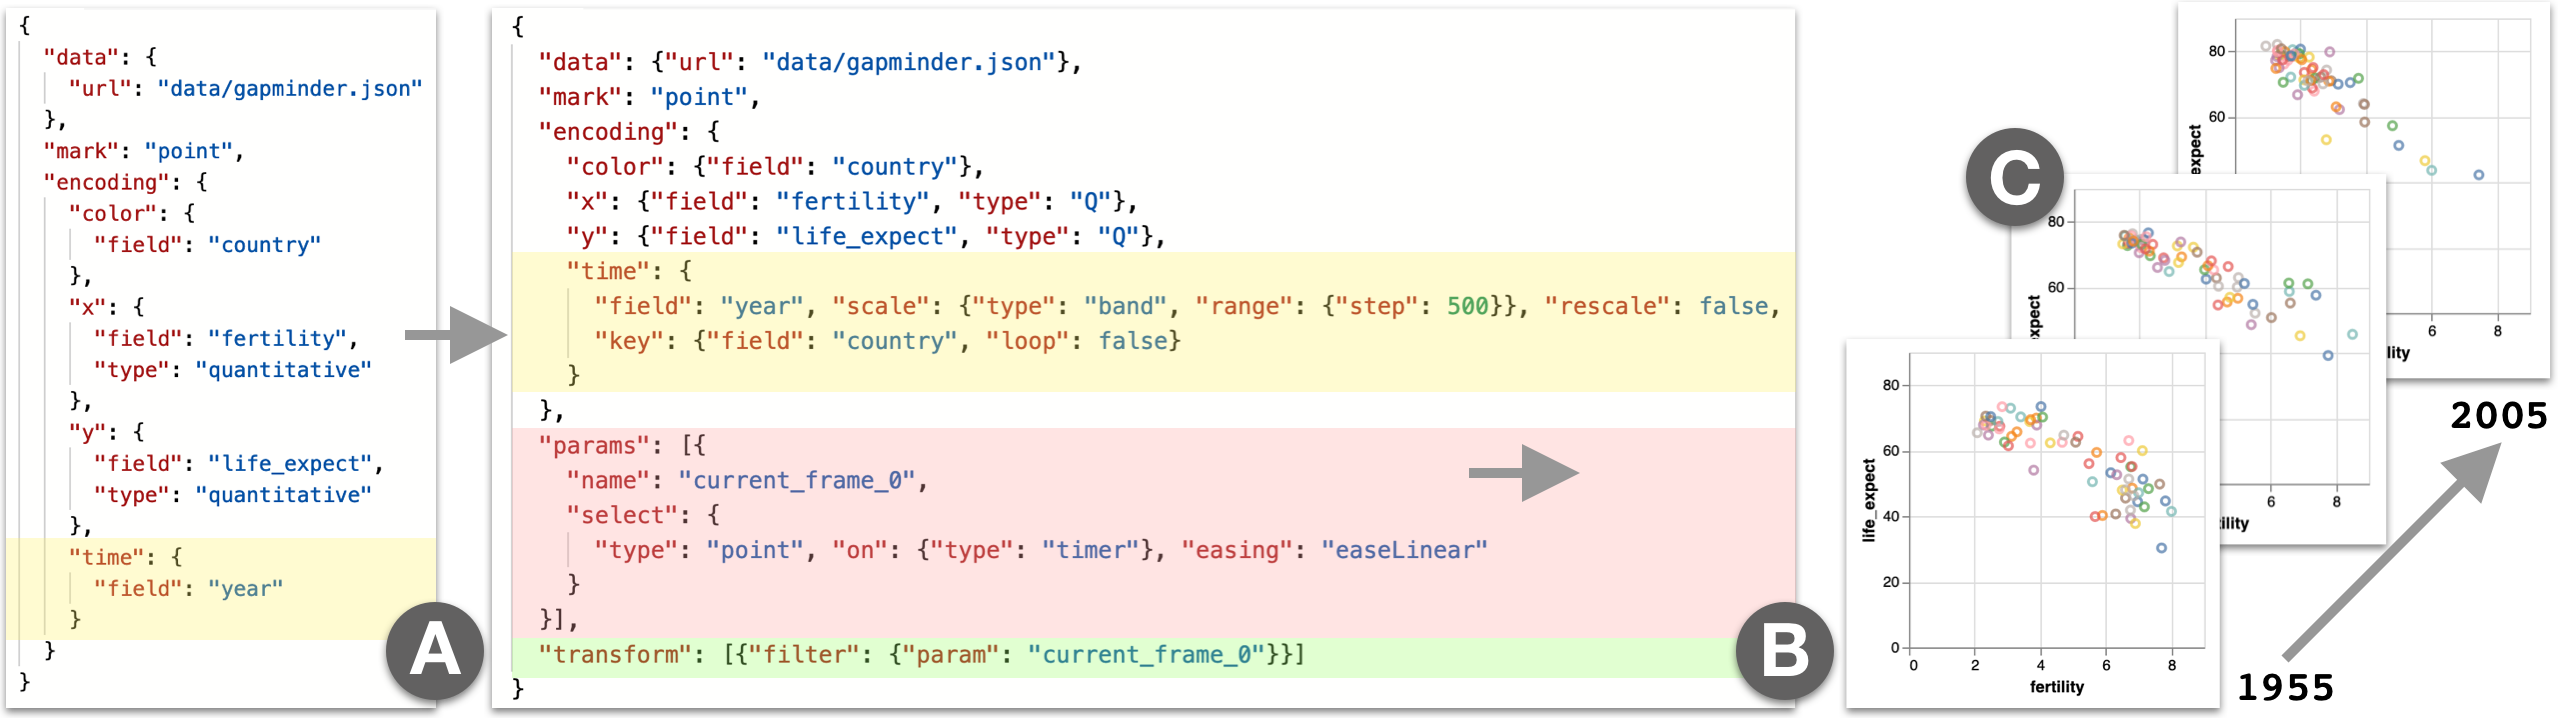
Fig. 2A shows the Animated Vega-Lite specification for Rosling’s Gapminder animation [34]. The time encoding, highlighted in yellow, maps the dataset’s year field to the time encoding channel. The system uses the distinct values of year to group rows into keyframes. In other words, there is one keyframe per possible value of year in the dataset (i.e. 1955, 1960, 1965, ..., 2005) (Fig. 2C).
4.1.1 Key Field
In-betweening, more commonly called
In the Gapminder example, Fig. 2B shows the Gapminder spec from Fig. 2A with default values specified explicitly. Here, country is used as the default key field as it is also encoded on the color encoding channel. Consider the successive keyframes with year values 1955 and 1960. For each year, each scatterplot point is identified by a unique country value. Therefore, to tween from 1955 to 1960, the system interpolates the two rows for each country to produce the corresponding in-between point at each animation frame.
4.1.2 Time Scale
An encoding uses a scale function to map from the data domain to a visual range. For spatial encoding channels, this range is measured in pixels relative to the bounding box of the rendered visualization. For the time encoding channel, we measure the range in milliseconds elapsed from the start of the animation. Users specify the timing of the animation using a time scale (for example, by specifying either an overall animation duration or the amount of time between keyframes as a step). As with existing encoding channels, if a scale is not specified by the user, Vega-Lite infers default scale properties. By default, scales for the time encoding channel use the unique values of the backing field as the scale domain, and create a default step range with 500ms per domain value. For example, the Gapminder domain is a list of every fifth year between 1955 and 2005, inclusive. The default range maps 1955 to 0ms, 1960 to 500ms, 1965 to 1000ms, and so on. A user can override this default range to slow down or speed up the animation.
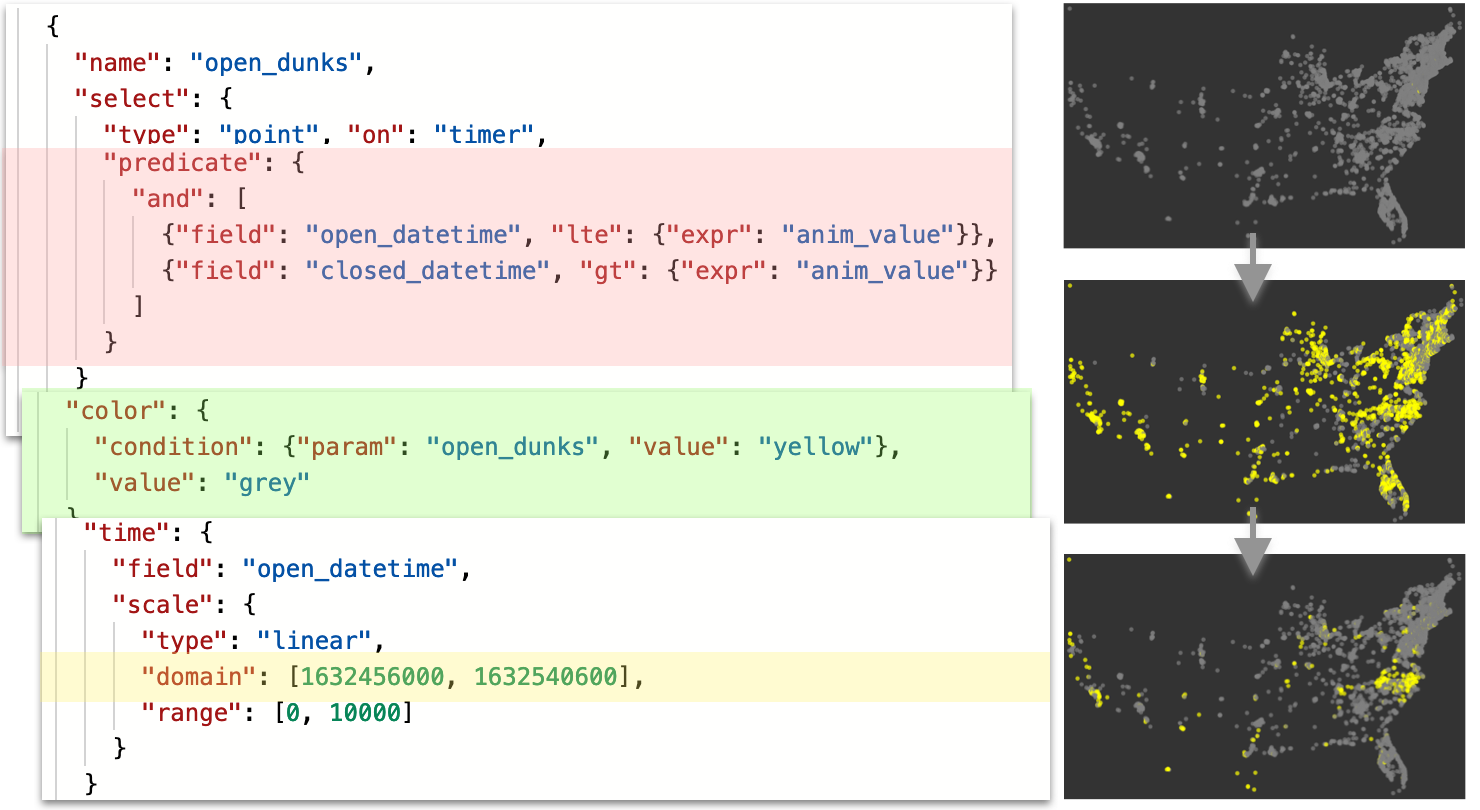
Though the default domain is sufficient to express most common animations, a user may want to override the domain. Supplying a custom domain is useful for specifying non-keyframe-based animations that require direct reference to in-between values, or require animating through values that are missing from the dataset. For example, Fig. 3 shows an example of such a use case. The animation should advance through 24-hour time span at a constant rate. However, the dataset does not contain a field that has values that are evenly spaced in the desired domain. So, with a default scale domain, the animation would appear to jump between time stamps rather than move through them smoothly. To achieve the desired behavior, the user instead specifies a custom domain representing the continuous interval between 00:00 and 23:30.
4.1.3 Re-scale
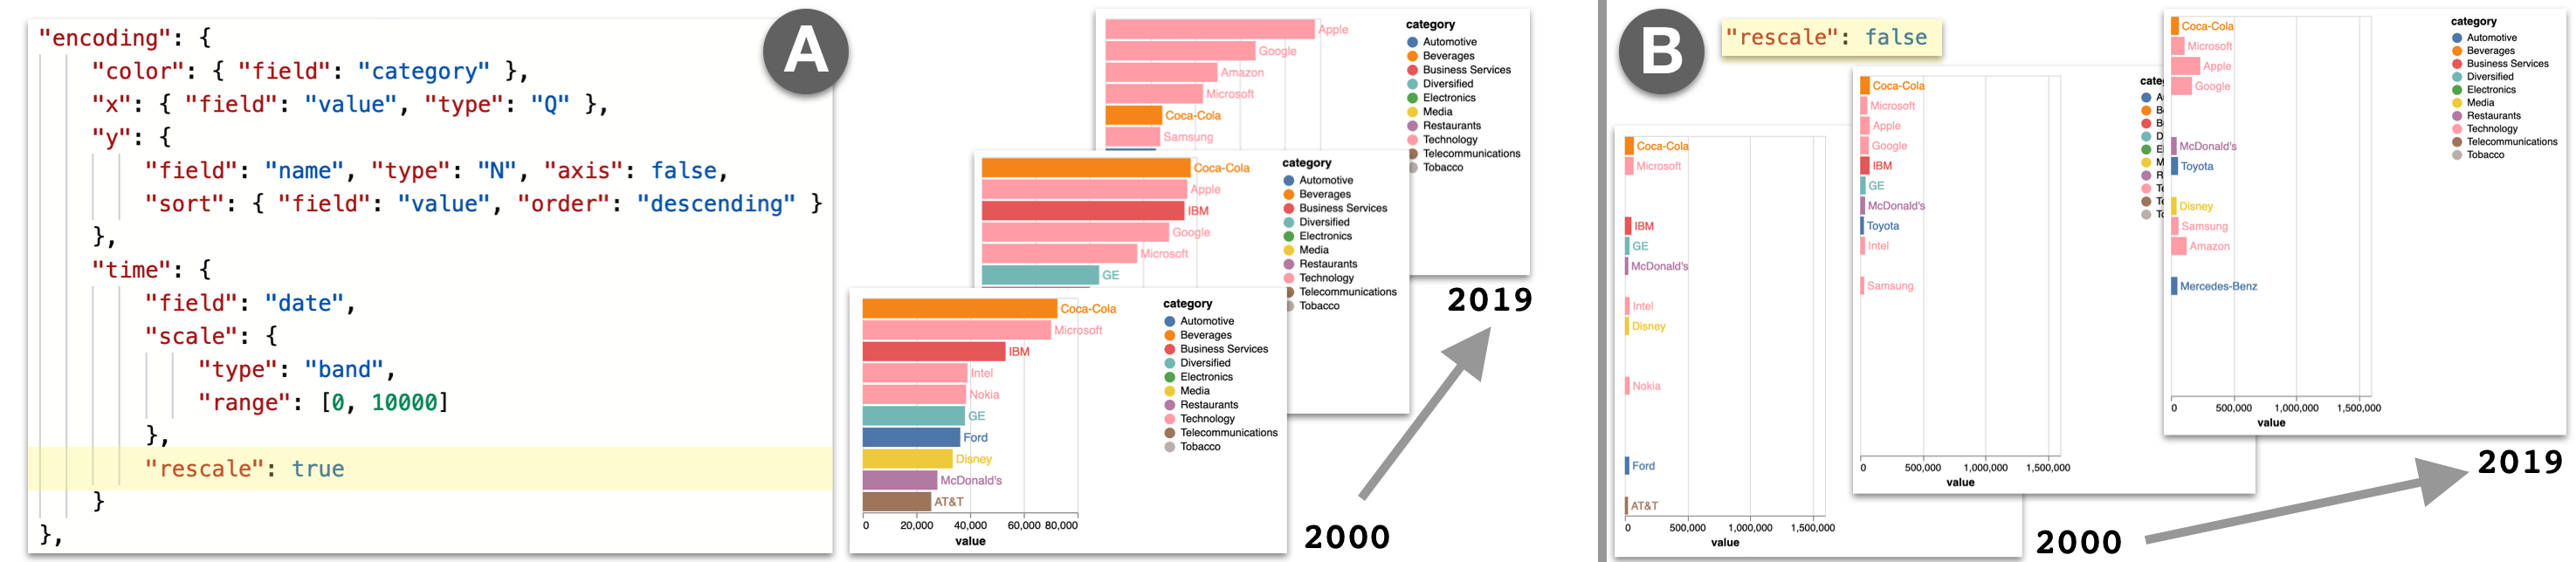
By default, the visualization’s data rectangle (or viewport) is fixed to the initial extents of the x- and y-scales calculated from the full dataset. However, for keyframe animations, only a subset of data is shown at any given time. If a user wants to re-calculate the viewport bounds based on only the data included in the current keyframe, rather than the original full dataset, they can set a flag in the time encoding called rescale. When rescale is true, the viewport’s bounds are recomputed at each step of the animation. We refer to this concept as re-scaling because re-calcuating the viewport bounds involves updating the domains of the x and y scales at each keyframe.
Fig. 4 demonstrates the use of rescale. Rescale is enabled in Fig. 4A, where the viewport updates according to the current selection. The visualization remains tightly zoomed on the currently displayed bars, with the longest bar always scaled to nearly the full width of the viewport. In contrast, Fig. 4B has rescaling disabled. The viewport is initially calculated with the full dataset and remains fixed. This would be appropriate for Gapminder, because we want to show the countries moving along a fixed scale. However, it is less helpful for bar chart race. Instead of enabling positional comparisons to a fixed scale, the animation prioritizes making the ordering of the top-ranked bars salient.
4.2 Selections with a Timer Event Stream
Animated selections are analogous to interactive selections. However, instead of reacting to input events, animated selections use a timer event stream to advance an internal clock representing the elapsed time of the animation in milliseconds (ms). This clock resets to 0ms when it reaches the end of the range defined by the time encoding’s scale (i.e. the animation loops the duration of the time scale’s range). As the clock updates, the elapsed time value is mapped to a value in the time domain (i.e. the time encoding’s field values). The animation selection updates to include all data points matching that value.
As selections rely on scales to convert map time to data values, selection-based animations still require a time encoding channel to be defined. In fact, all animations that can be expressed with only a time encoding can be elaborated into selection-based animations. In other words, selection-based animations are strictly more expressive than animations using only time encoding.
4.2.1 Applying Selections
In Vega-Lite, selections can be applied to other language constructs, including conditional mark encodings, scale domains, or data transformations [52].
This property of composition continues to hold with Animated Vega-Lite: animated and interactive selections can be used interchangeably wherever selections are supported in the Vega-Lite language.
Therefore, selections driven by timer events inherit the expressiveness of interactive selections in terms of Yi et al.’s taxonomy of interaction techniques [51].
Animations can be used to:
4.2.2 Predicate
As the animation’s elapsed time advances, the selection uses the scale defined in the time encoding to invert elapsed milliseconds (in the scale’s range) to a data value (in the scale’s domain). As a result, at any given time, there is an internal variable that has a data value corresponding to the animation’s current time. When the Vega-Lite specification is compiled into Vega, this variable is represented as a Vega signal called anim_value. In the Gapminder example, anim_value starts at 1955 at 0ms, and advances to 1960, 1965, ..., 2005.
To construct keyframes, the selection queries a subset of data tuples to include in the keyframe based on the current value of anim_value. By default, tuples are included in the keyframe if their value in the time encoding’s field (e.g. year for Gapminder) is equal to anim_value. However, to define alternate inclusion criteria for determining keyframes, users can specify custom predicate functions. For example, if at every step of the animation, a user wished to show all points with year less than or equal to anim_value, they would use the following predicate:
{"field": "year", "lte": "anim_value"}
Previously, Vega-Lite did not allow users to customize the selection predicate because the majority of interactions could be expressed using a combination of default predicates and selection transformations. Nonetheless, enabling predicate customization in the selection specification also increases the expressiveness of the interactive grammar.
4.2.3 Input Element Binding
Using the bind property, a user can populate a selection using a dynamic query widget (such as an HTML slider or checkbox). For animated selections, input element binding offers a convenient way to add interactive playback control to the animation. For instance, the user can bind an animated selection to a checkbox to toggle whether the animation is playing or paused. Similarly, they can bind a selection to a range slider and drag to scrub to a specific time in the animation.
Scrubbing the animation with the slider surfaces an interesting design challenge when combining animation and interaction: how should the system delegate control between the animation timer and user interaction? Initially, the animation is driven by the timer, with the slider visualizing timer updates. When the user starts dragging the slider, the system pauses the animation and delegates control to user interaction. Pausing is necessary so that the slider does not continue to advance forward while the user is currently scrubbing. When the user is done scrubbing, they may want to give control back to the animation. To facilitate this, Animated Vega-Lite automatically includes a play/pause checkbox alongside bound sliders. The user can simply re-check the box to give control over the animation back to the timer.
4.2.4 Pausing
Animated Vega-Lite supports pausing in two ways: by interaction, and by data value. Interactive pauses are specified using the filter property of Vega-Lite event streams. Users can provide the name of a Vega-Lite parameter to the filter property of a timer event stream. Parameters can be either selections or variables. When the provided parameter evaluates to true (i.e. is a non-empty selection or a true boolean variable), the filter will capture incoming events, preventing the animation clock from advancing. When the paramater evaluates to false, the events will resume propagating and the animation will continue. For example, a user can bind a checkbox to a parameter named is_playing, and use the following event stream definition to pause the visualization when the box is checked:
"on":{"type": "timer", "filter": "is_playing"}
Pausing by data value is specified using the pause property of an animated selection definition. The user provides a list of data values to pause on, and the duration of each pause. For example, a user can specify that the Gapminder animation should pause on the year 1995 for 2 seconds, to draw attention to the data for that year:
"pause": [{"value": 1995, "duration": 2000}]
4.2.5 Global Easing
5 Implementation
We implement Animated Vega-Lite using a prototype compiler, wrapping the existing Vega-Lite compiler to ingest Animated Vega-Lite specifications and output a lower-level Vega specification. The Animated Vega-Lite prototype compiler begins by expanding a user-supplied specification into a “normalized” format with all implicit default values filled in explicitly. This step includes generating default selections and transforms for animations specified using only time encodings, and filling in default scale and key definitions. This normalized specification is passed to the next compiler step to simplify processing.
To convert Animated Vega-Lite into low-level Vega, we use the existing Vega-Lite compiler to make the initial conversion into Vega (using a copy of the specification with animation removed), and then call a series of functions to compile animation-specific parts of the spec and merge them with the output Vega. Because Vega-Lite’s high-level abstractions do not have a one-to-one mapping to low-level Vega concepts, seemingly-isolated Vega-Lite fragments will typically make changes in many different parts of the Vega spec. Each of these functions takes in fragments of Animated Vega-Lite and standard Vega, and outputs a partial Vega specification that includes dataset, signal, scale, and mark definitions to merge into the output.
Compilation happens in six steps. First, compileAnimationClock uses definitions of animated selections and time encoding channels to create Vega signals and datasets for controlling the current state of the animation, handling pausing, and interfacing with interactive playback controls. Next, compileTimeScale takes in a definition of a time encoding alongside Vega marks and scales. It creates Vega-level scales for the time encoding, and signals to handle inversions between the animation clock and the corresponding data value at that time. It also applies rescaling to mark encodings if applicable. compileAnimationSelections then ingests definitions of animated selections to produce Vega signals and datasets that implement custom predicates, pausing and easing, and input element binding. Fourth, compileFilterTransforms takes animation selections and any filter transforms that reference those selections, and materializes the selections as filtered datasets in Vega. These datasets provide the backing data for rendering marks at each keyframe. compileKey then uses the time encoding specification to generate datasets and signals that handle tweening between keyframes. Finally, compileEnterExit supports top-level enter and exit encoding definitions in Animated Vega-Lite, converting them into Vega-level enter and exit encodings. Because of existing limitations in Vega, enter and exit currently are not well-supported for animation. However, pending Vega support, designers should be able to control the behavior of visual encodings as marks enter and exit the current keyframe.
We chose to implement our compiler as a wrapper around the existing Vega-Lite compiler in order to facilitate rapid prototyping. However, our current approach faces performance challenges that could be improved with internal changes to Vega and Vega-Lite. For example, we currently support tweening by creating three separate datasets: the current keyframe, the next keyframe, and a joined dataset with tweens computed as a derived column. This expensive operation causes noticeable lag on large datasets. In future implementations, we can instead create a Vega dataflow operator that leverages the animation’s semantics to compute tweens more efficiently. For example, instead of computing multiple datasets independently and performing a join, the operator can create a single dataset backed by a sliding window over the time facets.
6 Evaluation: Example Gallery
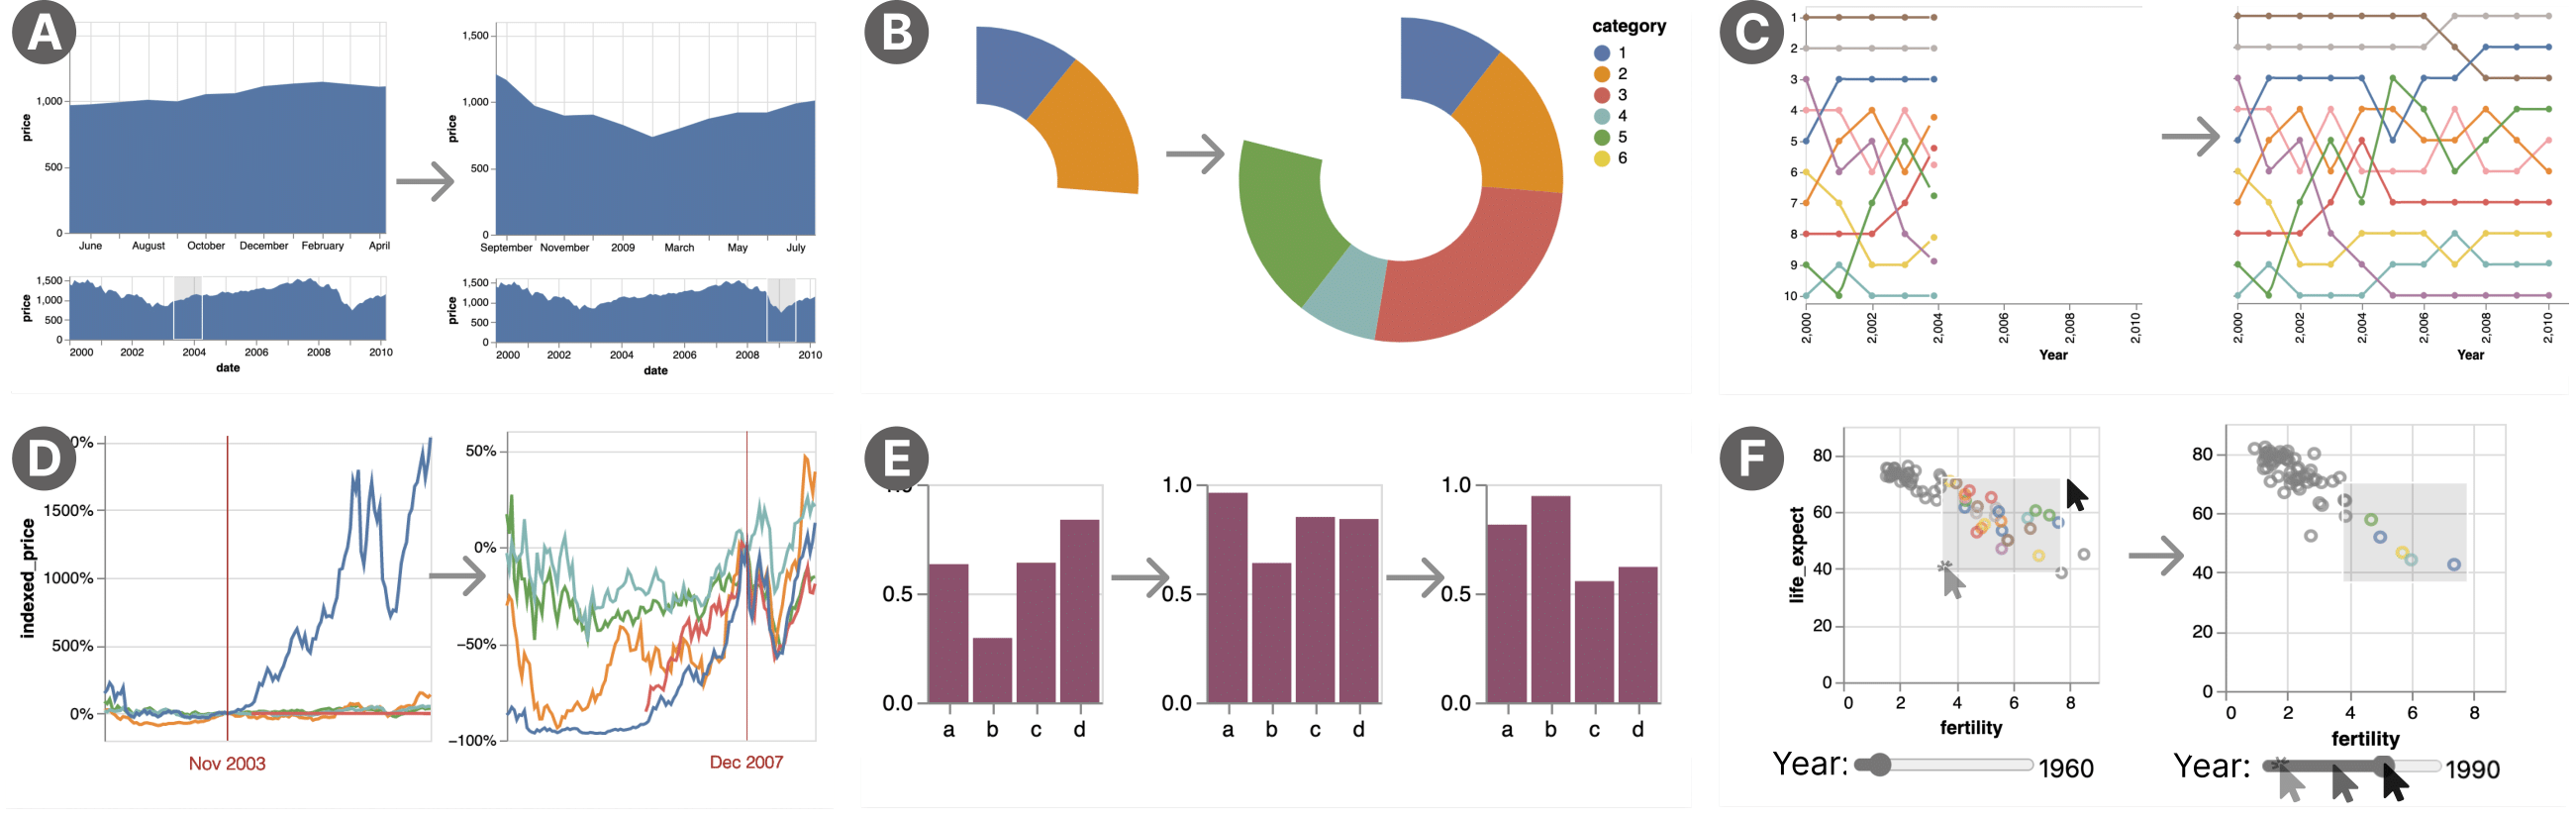
To evaluate Animated Vega-Lite’s expressiveness, we created an example gallery to demonstrate coverage over both Yi et al.’s taxonomy of interaction intents [51] and Heer & Robertson’s taxonomy of transition types in animated statistical graphics [11]. As Figure 5 shows, we support 6 / 7 interaction categories and 5 / 7 animation categories.
Figure 5a demonstrates an overview + detail visualization. A selection controls a brush over the bottom view, which sets the zoomed viewport of the top view. This selection is defined using a predicate that defines a sliding window over the x-axis field. When the brush is driven by animation, the selection is updated on each timer event. When the brush is driven by interaction, the selection is instead updated on drag events. Because the original Vega-Lite selection model unifies panning and zooming as selections applied to a scale domain, this approach can be adapted to animate arbitrary geometric panning and zooming behavior. This visualization demonstrates a
Figure 4 shows a bar chart’s x-scale dynamically recalculating on each frame using the rescale property of a time encoding (subsubsection 4.1.3). This animation technique demonstrates a
In Figure 3 and Figure 5b, we apply a conditional filter over the whole dataset, with filter parameters changing over time. In contrast to faceting, filtering can leverage custom selection predicates to show and hide data — a single data point can appear in multiple groups. Both taxonomies contain a category for
Figure 4 and Figure 5c show examples with a sorted axis. When a key is specified in a time encoding, the system automatically tweens an element’s position even when its sort index has changed in the next keyframe. Continually sorting elements as the underlying data changes demonstrates an
Time encodings transition between sequential time values by default in Animated Vega-Lite (e.g. Figure 2). Figure 5d demonstrates an additional example of this animation. A default animated point selection is applied to a data transform that re-normalizes a stock price time-series chart on each tick. The original Vega-Lite paper contains an interactive version of this example, which instead populates the point selection on mouse hover events [36]. These examples demonstrate
In addition to achieving broad coverage over the two taxonomies, our system also supports simulation techniques including hypothetical outcome plots (Figure 5e) [12]. And, as previously discussed in subsubsection 4.2.1, animated selections can be applied to the same set of dynamic visual behaviors as interactive selections. Consequently, users can easily switch between timer and input event streams when prototyping existing interaction techniques in Vega-Lite. For example, Figure 5a and Figure 5d show animated selections driving common interaction techniques — panning and re-normalizing, respectively. Users can also easily compose interaction techniques with animated visualizations by defining additional selections. For example, Figure 5f demonstrates an interactive brush used to highlight a region of an animated Gapminder visualization. Points of interest are conditionally colored as they enter or exit the brush region.
Discussion and Limitations. Like the original Vega-Lite, Animated Vega-Lite intentionally trades some limits to expressivity for gains in concise, high-level, declarative specification.
In Sects. 7.2.1 & 7.2.2, we detail this expressiveness tradeoff in terms of the classes of animation techniques (Animated Vega-Lite primarily supports
By extending Vega-Lite, Animated Vega-Lite also inherits its predecessor’s limitations.
For instance, Vega-Lite selections cannot alter visual encodings or data transformation pipelines at runtime (the
7 Evaluation: Critical Reflection
To identify our grammar’s design tradeoffs, we compared our approach to existing animated visualization grammars following the
Our goals were to (i) compare and contrast their design processes with ours, (ii) understand differences and design tradeoffs between their grammars and ours, and (iii) generate insights about the direction of future animation grammars. During the interviews, three of the authors of this paper began developing initial thematic hypotheses. After the interviews, we independently conducted a thematic analysis before finally coming together and synthesizing our insights, which we summarize below. These themes provide insight into the design of our grammar, and animated visualization grammars more generally.
7.1 Grammar Design Process
7.1.1 Specific Examples Motivate Grammar Design
When scoping their research projects, our interviewees prioritized motivating examples that they found personally compelling. For example, the authors of Data Animator and Gemini were both motivated in part by R2D3 [40]. As we discuss in the following subsections, the choosing examples to support leads to design tradeoffs, e.g. between scene- and segue-dominant abstractions (subsubsection 7.2.1). Thus, a handful of compelling in-the-wild examples can significantly influence the grammars developers build. Other examples that were cited across multiple interviews included Gapminder [34], Periscopic’s Gun Deaths [30], and animations in the New York Times (NYT) and the Guardian.
On the other hand, a
With Animated Vega-Lite, we were motivated by the large collection of existing examples with static encodings, such as those in the Data-Gifs example gallery. This category includes many prominent designs like Gapminder and bar chart races. Rather than focus on developing an expressive language of transitions between keyframes, we focused on an expressive language of keyframe generation via selections. Our abstractions facilitate the design of visualizations that must produce many keyframes backed by a fixed encoding.
7.1.2 Natural Programming vs. Core Calculus Design
To make their systems easy to use for their target audiences, the authors of Data Animator and Gemini aimed to develop grammars that matched the existing mental models of animation designers.
To that end, both groups conducted interviews prompting experienced animators to sketch interfaces or write pseudocode to recreate exemplar animated visualizations [45, 19].
Fundamental abstractions emerged from these formative studies.
For instance, Gemini’s studies yielded the concepts of synchronizing (
In contrast, we set out to develop a small
Analyzing these processes via the Cognitive Dimensions of Notation [44], we find that iterating closely with end users in a natural programming process yields a grammar that
7.2 Animation Abstractions and Design Considerations
7.2.1 Scene- vs. Segue-Dominant Abstractions
Several interviewees noted that Animated Vega-Lite’s abstractions appear complementary to their systems. For example, Kim noted his conceptual distinction between Animated Vega-Lite and Gemini is
Using this scene and segue distinction, Animated Vega-Lite and gganimate may be categorized as
On the other hand, Data Animator, Canis, and Gemini are
As discussed in section 6, Animated Vega-Lite inherits Vega-Lite’s inability to represent complex runtime changes to visual encodings and data transformations. We suspect that extending Vega-Lite with these capabilities could enable segue animations in a future version of Animated Vega-Lite. To support complex runtime changes, Vega-Lite’s conditional encodings could be extended from just mark properties to mark types and data transforms as in Ivy [24]. And our support for enter and exit could be extended to operate not just on data, but also on these more expressive encoding changes.
7.2.2 Modeling Transitions Between Keyframes
Keyframes were the most salient animation abstraction in our interviews. We discussed keyframe concepts with every interviewee, and they would often use keyframes to pose comparisons between different systems’ abstractions. Every tool had to make decisions about (i) how to generate keyframes and (ii) how to transition between them. Moreover, keyframes and transitions are useful abstractions for both scene- and segue-dominant systems. In this subsection we surface an axis of the keyframe design space: modeling transitions between keyframes.
Non-parametric transitions.
The simplest kind of transition between keyframes is a non-parametric transition.
Consider a linear sequence of keyframes, where each keyframe describes an entire scenegraph.
Transitions between these keyframes are
Animated Vega-Lite supports non-parametric transitions via its timer, easing, and interpolation abstractions, which implicitly specify a transition across keyframes. The other libraries also support non-parametric transitions between pairs of keyframes, but only scene-dominant systems (gganimate and Animated Vega-Lite) support non-parametric transitions across
Parametric transitions.
In contrast to non-parametric transitions,
Segue-dominant systems Data Animator, Canis, and Gemini all support parametric transitions. But, as Thompson identified in his post-interview, parametric transitions also increase the expressive gamut of scene animations.
For example, Figure 6 shows “Swimming World Records Throughout History” from the Data Animator example gallery. This animated scatterplot shows replays of world record swimmers. The input data includes swimmers and their final race times. When Thompson tried to port this example to Animated Vega-Lite, he realized he
To support parametric transitions, future versions of Animated Vega-Lite could use Lu et al.’s concept of “dynamic functions” [23]. These functions use mappings between data and transitions to specify rate-of-change properties of transitions over time (e.g., encoding transition speed instead of mark position). Adapting this segue-dominant concept to Animated Vega-Lite could increase expressivity, though further work is required to understand its composition with and implications for static and interactive language constructs. For instance, segue transition properties may more easily compose with existing static and interactive Vega-Lite constructs if translated back into scene keyframes as direct encodings instead of rates (e.g. instantiating transition speed as additional position keyframes). However, this would trade off the memory efficiency of the segue representation.
Connecting transitions in series and parallel.
Some of the most compelling animated examples cannot be represented as a linear sequence of transitions, parametric or not.
For instance, Periscopic’s Gun Deaths animation [30], a visualization frequently cited by our interviewees, cannot easily be represented even by parametric transitions.
When discussing this example, Thompson remarked:
Gemini’s
However, this abstraction alone is not enough. While Gemini has a rich transition language, it cannot generate keyframes automatically from data like Animated Vega-Lite. This generation is necessary for the Gun Deaths animation to visualize individual points. Combining Gemini’s segue abstractions with Animated Vega-Lite’s scene abstractions is a promising future direction for expressive animation.
8 Conclusion and Future Work
Animated Vega-Lite contributes a low viscosity, compositional, and systematically enumerable grammar that unifies specification of static, interactive, and animated visualizations. Within a single grammar, authors can now easily switch between the three modalities during rapid prototyping, and also compose them together to effectively communicate and analyze faceted and time-varying data.
Our grammar takes a promising step in helping authors develop visualizations that leverage the dynamic affordances of computational media.
During interviews, Pedersen described unification as the “holy grail” of data visualization APIs:
Beyond language design, we hope that Animated Vega-Lite facilitates future work on interactive and animated visualization akin to the role the original Vega-Lite has played. For instance, how might we leverage Animated Vega-Lite’s ability to enumerate static, interactive, and animated visualizations to study how these modalities facilitate data analysis and communication — replicating and extending prior work [33] more systematically? Similarly, how might study results be codified in the Draco knowledge base [28], or exposed in systems like Voyager [49, 50] or Lux [22] to recommend animated visualizations during exploratory data analysis? To support this future research, we intend to contribute our work back to the open source Vega-Lite project.
Acknowledgements
We thank our critical reflections interlocutors and anonymous reviewers. This work was supported by NSF grants #1942659 and #1900991 and by the NSF’s SaTC Program. This material is based upon work supported by the National Science Foundation under Grant No. 1745302.References
- [1] (2013-02) Does interactive animation control improve exploratory data analysis of animated trend visualization?. In Visualization and Data Analysis 2013, Vol. 8654, pp. 211–223. Link, Document Cited by: §2.1.
- [2] (2011-12) D³ Data-Driven Documents. IEEE Transactions on Visualization and Computer Graphics 17 (12), pp. 2301–2309 (en). ISSN 1077-2626, Link, Document Cited by: §1, §2.2.
- [3] (2006-01) The relevance of attention for selecting news content. An eye-tracking study on attention patterns in the reception of print and online media. Communications 31 (3) (en). ISSN 0341-2059, 1613-4087, Link, Document Cited by: §2.1.
- [4] (2014-12) The Not-so-Staggering Effect of Staggered Animated Transitions on Visual Tracking. IEEE Transactions on Visualization and Computer Graphics 20 (12), pp. 2241–2250. Note: Conference Name: IEEE Transactions on Visualization and Computer Graphics ISSN 1941-0506, Document Cited by: §2.1.
- [5] (2021-07) PLIERS: A Process that Integrates User-Centered Methods into Programming Language Design. ACM Transactions on Computer-Human Interaction 28 (4), pp. 28:1–28:53. ISSN 1073-0516, Link, Document Cited by: §7.1.2, §7.1.2.
- [6] (2011-05) Temporal distortion for animated transitions. In Proceedings of the SIGCHI Conference on Human Factors in Computing Systems, Vancouver BC Canada, pp. 2009–2018 (en). , Link, Document Cited by: §2.1.
- [7] (1997-08) Functional reactive animation. In Proceedings of the second ACM SIGPLAN international conference on Functional programming, ICFP ’97, New York, NY, USA, pp. 263–273. , Link, Document Cited by: §3.1.
- [8] (2021-05) CAST: Authoring Data-Driven Chart Animations. In Proceedings of the 2021 CHI Conference on Human Factors in Computing Systems, CHI ’21, New York, NY, USA, pp. 1–15. , Link, Document Cited by: §1, §1, §2.2, §7.
- [9] (2020) Canis: A High-Level Language for Data-Driven Chart Animations. Computer Graphics Forum. Note: Publisher: The Eurographics Association and John Wiley & Sons Ltd. ISSN 1467-8659, Document Cited by: §1, §1, §2.2, §7.
- [10] (2020-12) Learning From Science News via Interactive and Animated Data Visualizations: An Investigation Combining Eye Tracking, Online Survey, and Cued Retrospective Reporting. Science Communication 42 (6), pp. 803–828. Note: Publisher: SAGE Publications Inc ISSN 1075-5470, Link, Document Cited by: §2.1.
- [11] (2007-11) Animated Transitions in Statistical Data Graphics. IEEE Transactions on Visualization and Computer Graphics 13 (6), pp. 1240–1247 (en). ISSN 1077-2626, Link, Document Cited by: §1, §2.1, §3.1, Table 1, Figure 5, §6, §6, §7.2.2.
- [12] (2015-11) Hypothetical Outcome Plots Outperform Error Bars and Violin Plots for Inferences about Reliability of Variable Ordering. PLOS ONE 10 (11), pp. e0142444 (en). Note: Publisher: Public Library of Science ISSN 1932-6203, Link, Document Cited by: §2.1, §6.
- [13] (2007-05) Matplotlib: A 2D Graphics Environment. Computing in Science Engineering 9 (3), pp. 90–95. Note: Conference Name: Computing in Science Engineering ISSN 1558-366X, Document Cited by: §2.2.
- [14] (2014-05) How Not to Be Misled by the Jobs Report. The New York Times (en-US). ISSN 0362-4331, Link Cited by: Figure 5.
- [15] (2020) Swimming World Records throughout History. Link Cited by: Figure 6.
- [16] (2019-01) Hypothetical Outcome Plots Help Untrained Observers Judge Trends in Ambiguous Data. IEEE Transactions on Visualization and Computer Graphics 25 (1), pp. 892–902 (en). ISSN 1077-2626, 1941-0506, 2160-9306, Link, Document Cited by: §2.1.
- [17] (2019) Designing Animated Transitions to Convey Aggregate Operations. Computer Graphics Forum 38 (3), pp. 541–551 (en). ISSN 1467-8659, Link, Document Cited by: §2.1.
- [18] (2021-10) Gemini^2: Generating Keyframe-Oriented Animated Transitions Between Statistical Graphics. In 2021 IEEE Visualization Conference (VIS), New Orleans, LA, USA, pp. 201–205 (en). , Link, Document Cited by: §1, §1, §2.2, §7.
- [19] (2021) Gemini: A Grammar and Recommender System for Animated Transitions in Statistical Graphics. IEEE Transactions on Visualization and Computer Graphics 27 (2), pp. 485–494. Document Cited by: §1, §1, §2.2, §7.1.2, §7.
- [20] (2014-12) DimpVis: Exploring Time-varying Information Visualizations by Direct Manipulation. IEEE Transactions on Visualization and Computer Graphics 20 (12), pp. 2003–2012. Note: Conference Name: IEEE Transactions on Visualization and Computer Graphics ISSN 1941-0506, Document Cited by: §3.1.
- [21] (2016-01) Convergence of broad-scale migration strategies in terrestrial birds. Proceedings of the Royal Society B: Biological Sciences 283 (1823), pp. 20152588. Note: Publisher: Royal Society Link, Document Cited by: §3.2.
- [22] (2021-11) Lux: always-on visualization recommendations for exploratory dataframe workflows. Proceedings of the VLDB Endowment 15 (3), pp. 727–738. ISSN 2150-8097, Link, Document Cited by: §8.
- [23] (2022-07) Enhancing Static Charts With Data-Driven Animations. IEEE Transactions on Visualization and Computer Graphics 28 (7), pp. 2628–2640. Note: Conference Name: IEEE Transactions on Visualization and Computer Graphics ISSN 1941-0506, Document Cited by: §7.2.2.
- [24] (2021-05) Integrated Visualization Editing via Parameterized Declarative Templates. In Proceedings of the 2021 CHI Conference on Human Factors in Computing Systems, Yokohama Japan, pp. 1–14 (en). , Link, Document Cited by: §7.2.1.
- [25] (2009-10) Flapjax: a programming language for Ajax applications. In Proceedings of the 24th ACM SIGPLAN conference on Object oriented programming systems languages and applications, OOPSLA ’09, New York, NY, USA, pp. 1–20. , Link, Document Cited by: §3.1.
- [26] (2015) D3-ease. Note: https://github.com/d3/d3-ease Link Cited by: §4.2.5.
- [27] (2019) Bar Chart Race, Explained. Note: https://observablehq.com/@d3/bar-chart-race-explained Link Cited by: Figure 4.
- [28] (2019-01) Formalizing Visualization Design Knowledge as Constraints: Actionable and Extensible Models in Draco. IEEE Transactions on Visualization and Computer Graphics 25 (1), pp. 438–448. Note: Conference Name: IEEE Transactions on Visualization and Computer Graphics ISSN 1941-0506, Document Cited by: §8.
- [29] (2004-09) Natural programming languages and environments. Communications of the ACM 47 (9), pp. 47–52. ISSN 0001-0782, Link, Document Cited by: §7.1.2.
- [30] (2013) United States gun death data visualization. Link Cited by: §7.1.1, §7.2.2.
- [31] (2012) Plotly Graphing Libraries. Note: https://plotly.com/graphing-libraries/ Link Cited by: §1, §2.2.
- [32] (2018-10) Reflecting on the Evaluation of Visualization Authoring Systems : Position Paper. In 2018 IEEE Evaluation and Beyond - Methodological Approaches for Visualization (BELIV), pp. 86–92. Document Cited by: §1.
- [33] (2008-11) Effectiveness of Animation in Trend Visualization. IEEE Transactions on Visualization and Computer Graphics 14 (6), pp. 1325–1332 (en). ISSN 1077-2626, Link, Document Cited by: §1, §2.1, §2.1, §8.
- [34] (2006) The best stats you’ve ever seen. Note: https://www.ted.com/talks/hans_rosling_the_best_stats_you_ve_ever_seen Link Cited by: Figure 2, §3.1, §4.1, §7.1.1.
- [35] (2019) Critical Reflections on Visualization Authoring Systems. IEEE Transactions on Visualization and Computer Graphics, pp. 1–1 (en). ISSN 1077-2626, 1941-0506, 2160-9306, Link, Document Cited by: §1, §7, footnote 1.
- [36] (2017-01) Vega-Lite: A Grammar of Interactive Graphics. IEEE Transactions on Visualization and Computer Graphics 23 (1), pp. 341–350. Note: Conference Name: IEEE Transactions on Visualization and Computer Graphics ISSN 1941-0506, Document Cited by: §1, §6.
- [37] (2016-01) Reactive Vega: A Streaming Dataflow Architecture for Declarative Interactive Visualization. IEEE Transactions on Visualization and Computer Graphics 22 (1), pp. 659–668. Note: Conference Name: IEEE Transactions on Visualization and Computer Graphics ISSN 1941-0506, Document Cited by: §3.1.
- [38] (2014-10) Declarative interaction design for data visualization. In Proceedings of the 27th annual ACM symposium on User interface software and technology, UIST ’14, New York, NY, USA, pp. 669–678. , Link, Document Cited by: §1, §3.1.
- [39] (2021-02) What Makes a Data-GIF Understandable?. IEEE Transactions on Visualization and Computer Graphics 27 (2), pp. 1492–1502 (en). ISSN 1077-2626, 1941-0506, 2160-9306, Link, Document Cited by: §7.1.1.
- [40] (2015) A visual introduction to machine learning, Part II. (en). Note: http://www.r2d3.us/visual-intro-to-machine-learning-part-2/ Link Cited by: §7.1.1.
- [41] (2019) A Grammar of Animated Graphics. (en). Note: https://gganimate.com/ Link Cited by: §1, §7.
- [42] (2018-07) The Grammar of Animation. Note: https://www.youtube.com/watch?v=21ZWDrTukEs Link Cited by: §7.2.1.
- [43] (2019) Gganimate has transitioned to a state of release. (en). Note: https://www.data-imaginist.com/2019/gganimate-has-transitioned-to-a-state-of-release/ Link Cited by: §1, §2.2.
- [44] (1989) Cognitive dimensions of notations. In People and Computers V, A. Sutcliffe and L. Macaulay (Eds.), Cambridge, UK, pp. 443–460. Link Cited by: §1, §2.2, §3.1, §7.1.2.
- [45] (2020) Understanding the Design Space and Authoring Paradigms for Animated Data Graphics. Computer Graphics Forum 39 (3), pp. 207–218 (en). ISSN 1467-8659, Link, Document Cited by: §7.1.2.
- [46] (2021-05) Data Animator: Authoring Expressive Animated Data Graphics. In Proceedings of the 2021 CHI Conference on Human Factors in Computing Systems, CHI ’21, New York, NY, USA, pp. 1–18. , Link, Document Cited by: §1, §1, §2.2, §7.
- [47] (2002-10) Animation: can it facilitate?. International Journal of Human-Computer Studies 57 (4), pp. 247–262 (en). ISSN 10715819, Link, Document Cited by: §2.1.
- [48] (2022) Series–parallel graph — Wikipedia, The Free Encyclopedia. Note: [Online; accessed 1-July-2022] Link Cited by: §7.2.2.
- [49] (2016-01) Voyager: Exploratory Analysis via Faceted Browsing of Visualization Recommendations. IEEE Transactions on Visualization and Computer Graphics 22 (1), pp. 649–658. Note: Conference Name: IEEE Transactions on Visualization and Computer Graphics ISSN 1941-0506, Document Cited by: §8.
- [50] (2017-05) Voyager 2: Augmenting Visual Analysis with Partial View Specifications. In Proceedings of the 2017 CHI Conference on Human Factors in Computing Systems, CHI ’17, New York, NY, USA, pp. 2648–2659. , Link, Document Cited by: §8.
- [51] (2007-11) Toward a Deeper Understanding of the Role of Interaction in Information Visualization. IEEE Transactions on Visualization and Computer Graphics 13 (6), pp. 1224–1231 (en). ISSN 1077-2626, 1941-0506, 2160-9306, Link, Document Cited by: §1, §3.1, Table 1, §4.2.1, Figure 5, §6, §6.
- [52] (2021-02) Lyra 2: Designing Interactive Visualizations by Demonstration. IEEE Transactions on Visualization and Computer Graphics 27 (2), pp. 304–314 (en). ISSN 1077-2626, 1941-0506, 2160-9306, Link, Document Cited by: §4.2.1.